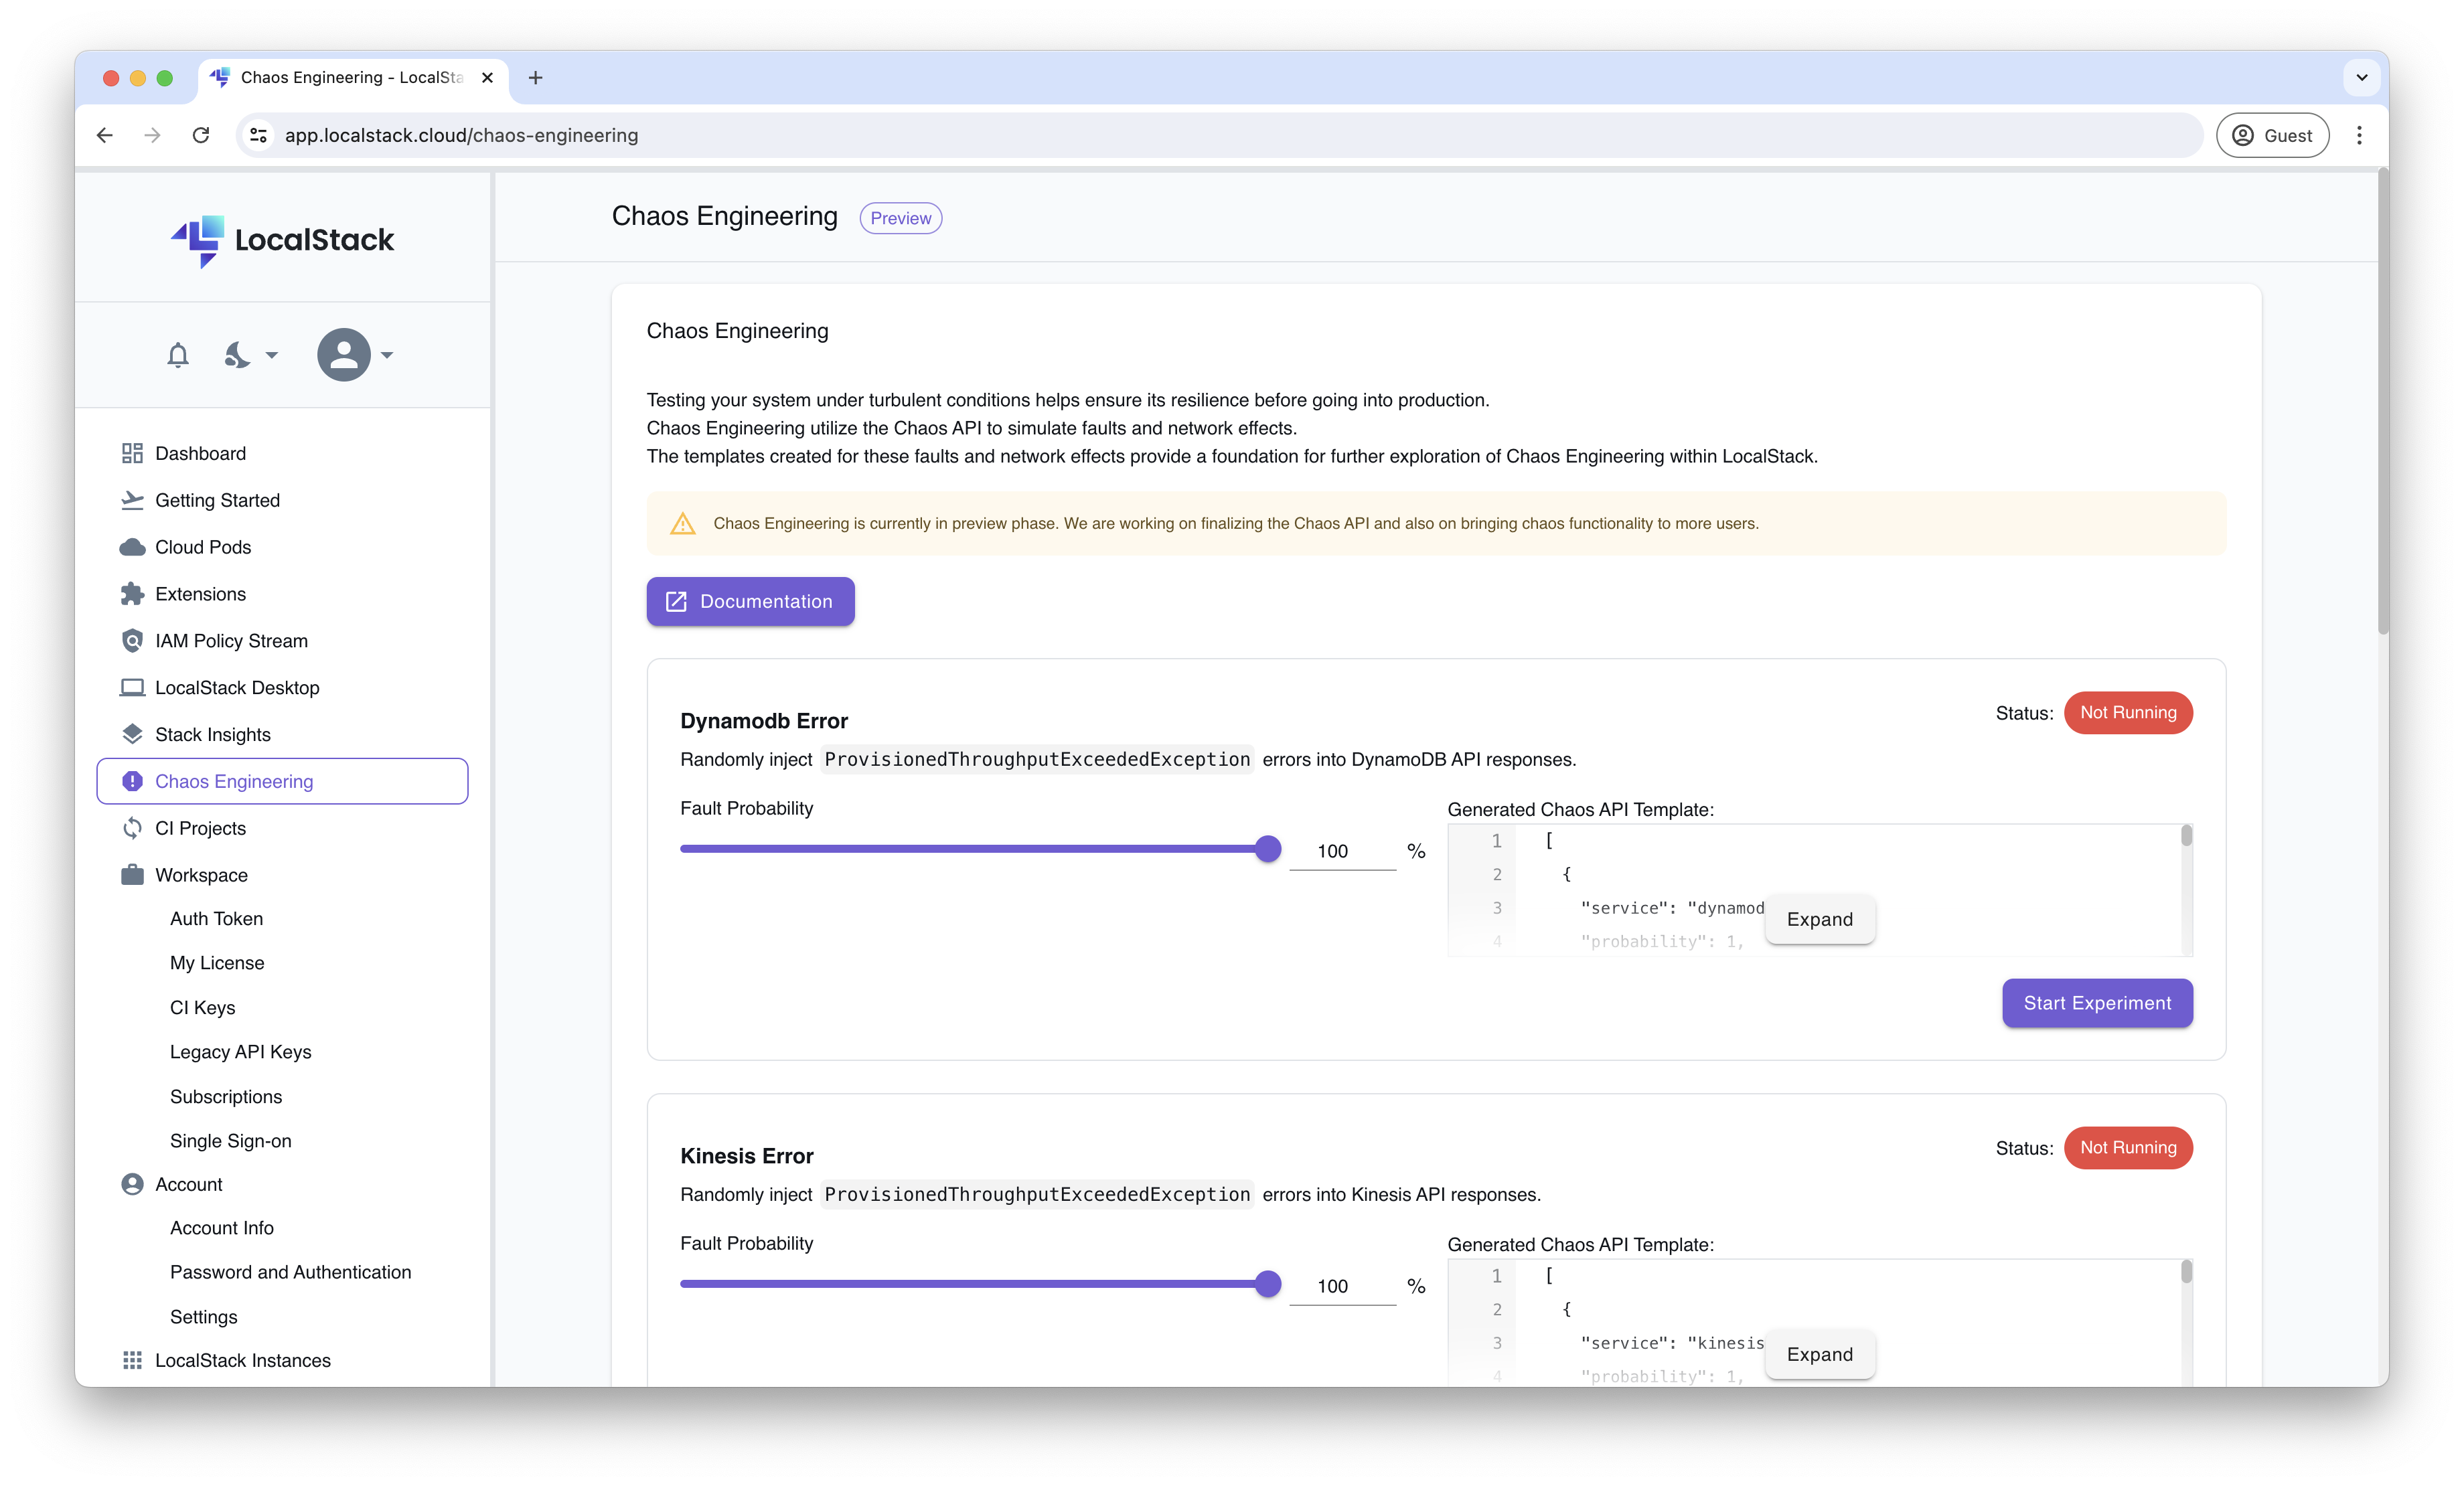
Chaos Engineering Dashboard
Chaos Engineering Dashboard allows users to run chaos experiments within their application stack to test the system’s resilience.
less than a minute
Introduction
The Chaos Engineering Dashboard in LocalStack offers streamlined testing for cloud applications, enabling you to simulate server errors, service outages, regional disruptions, and network latency with ease, ensuring your app is ready for real-world challenges.
The dashboard uses LocalStack Chaos API under the hood to offer a set of customizable templates that can be seamlessly integrated into any automation workflows.

You can find this feature in the LocalStack Web Application by navigating to app.localstack.cloud/chaos-engineering.
Note
Chaos Engineering Dashboard is offered as a preview feature and is under active development.Features
The dashboard offers the following features:
- DynamoDB Error: Randomly inject
ProvisionedThroughputExceededExceptionerrors into DynamoDB API responses. - Kinesis Error: Randomly inject
ProvisionedThroughputExceededExceptionerrors into Kinesis API responses. - 500 Internal Error: Randomly terminate incoming requests, returning an
Internal Server Errorwith a response code of 500. - Service Unavailable: Cause a specified percentage of service API calls to receive a 503
Service Unavailableresponse. - AWS Region Unavailable: Simulate regional outages and failovers by disabling entire AWS regions.
- Latency: Introduce specified latency to every API call, useful for simulating network latency or degraded network performance.