Remote Debugging
Overview
Section titled “Overview”Lambda Remote Debugging lets you use breakpoints, inspect variables, and step through your Lambda function code locally within VS Code. It is supported for Python, Node.js, and Java, and works with SAM-based or standalone Lambda projects.
Lambda Remote Debugging with AWS Toolkit for VS Code
Section titled “Lambda Remote Debugging with AWS Toolkit for VS Code”This guide describes how to use the AWS Toolkit for VS Code to debug Lambda functions running in LocalStack. This new integration enables interactive, IDE-native debugging for Python, Node.js, and Java Lambda functions with minimal setup.
Key Benefits
Section titled “Key Benefits”- One-click remote automatic debugger configuration and injection via the AWS Toolkit for VS Code
- Automatic Timeout Management
- Support for Python, Node.js, and Java runtimes
Getting Started with AWS Toolkit (VS Code)
Section titled “Getting Started with AWS Toolkit (VS Code)”Prerequisites
Section titled “Prerequisites”- Upgrade to LocalStack v4.8 (or higher) for both your LocalStack CLI and your LocalStack Docker image.
- VS Code (>= v1.83.0)
- AWS Toolkit for VS Code (>= v3.74)
- LocalStack Toolkit for VS Code (>= v1.2.0)
- Docker
- A valid LocalStack Auth Token. Sign up for a free LocalStack account.
- A valid auth token
- VS Code running on the same machine as LocalStack (container-based setups like Kubernetes are not yet supported).
Setup Steps
Section titled “Setup Steps”The following setup creates the required ~/.aws/config and ~/.aws/credentials entries and ensures LocalStack runs with your active license.
- Install AWS Toolkit and LocalStack Toolkit from the VS Code Marketplace.
- Install the latest version of the AWS SAM CLI for using the AWS Application builder functionality in the AWS Toolkit.
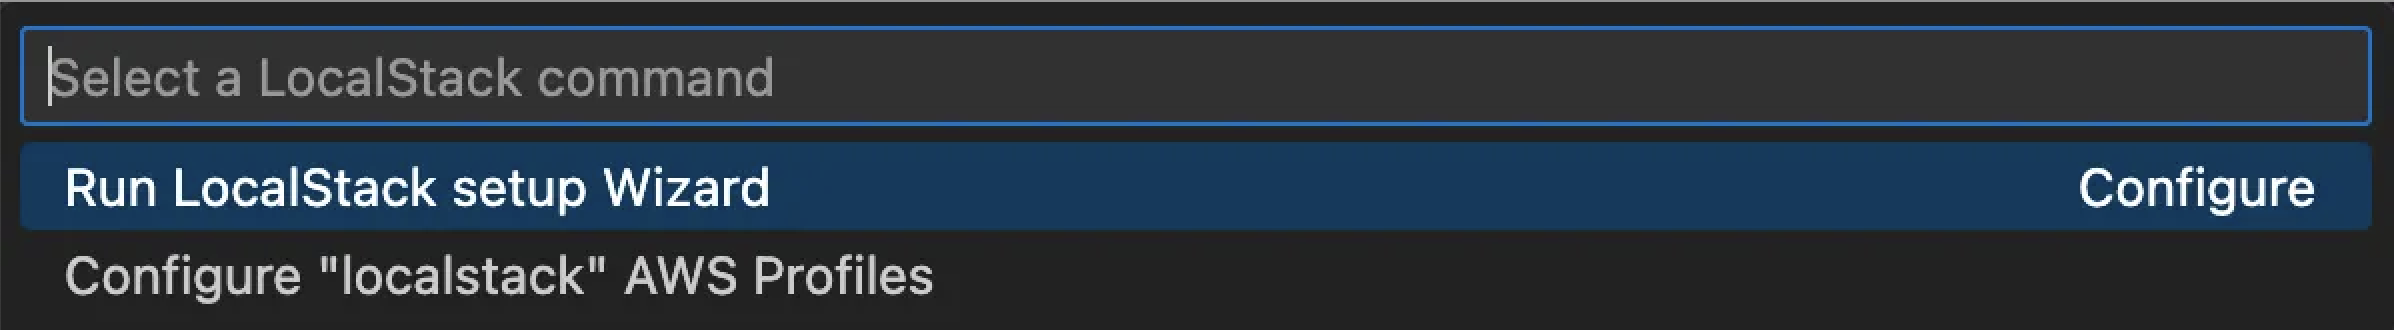
- Run the
LocalStack: Run Setup Wizardfrom the Command Palette. (This sets your auth token and configures thelocalstackAWS profile.)
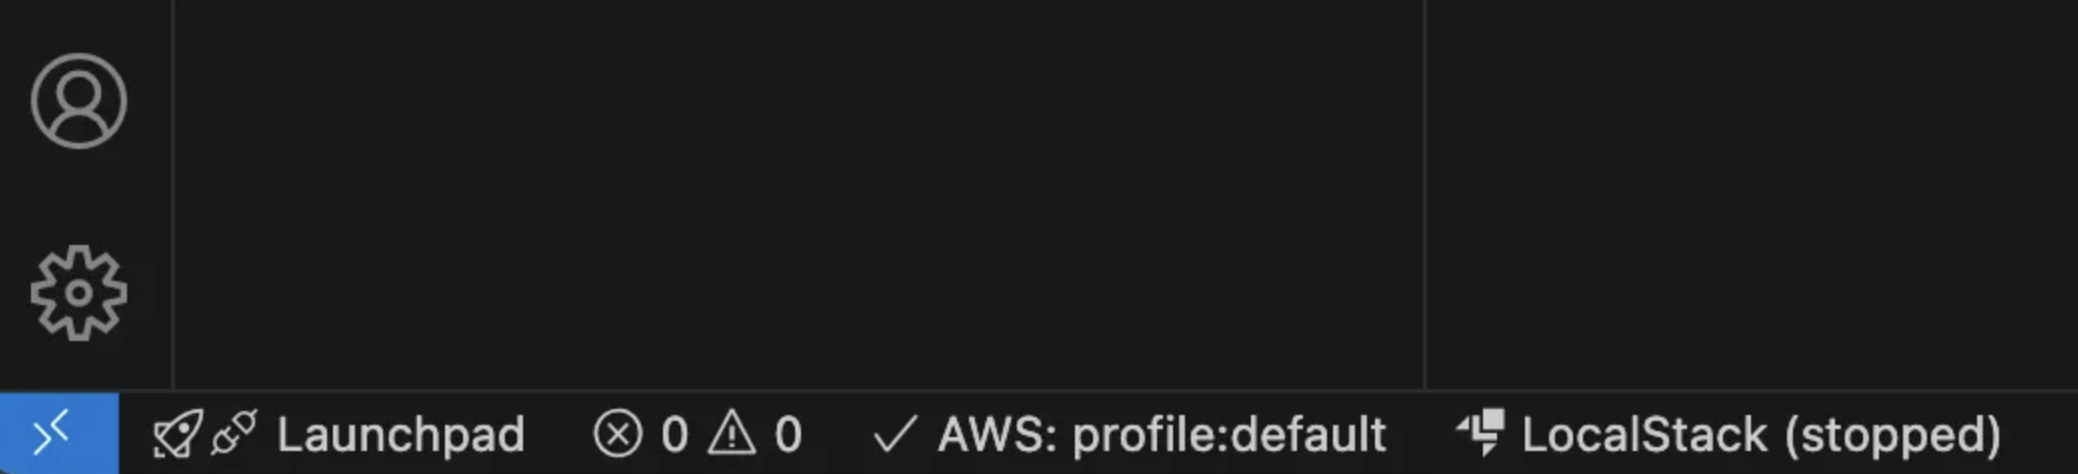
- Start LocalStack using the status bar or the command
Start LocalStack. - Switch your AWS profile in the status bar to
profile:localstack.
Debugging Node.js, Python, Java (with Examples)
Section titled “Debugging Node.js, Python, Java (with Examples)”You can debug either your own Lambda function or our sample project.
Use AWS Toolkit Sample
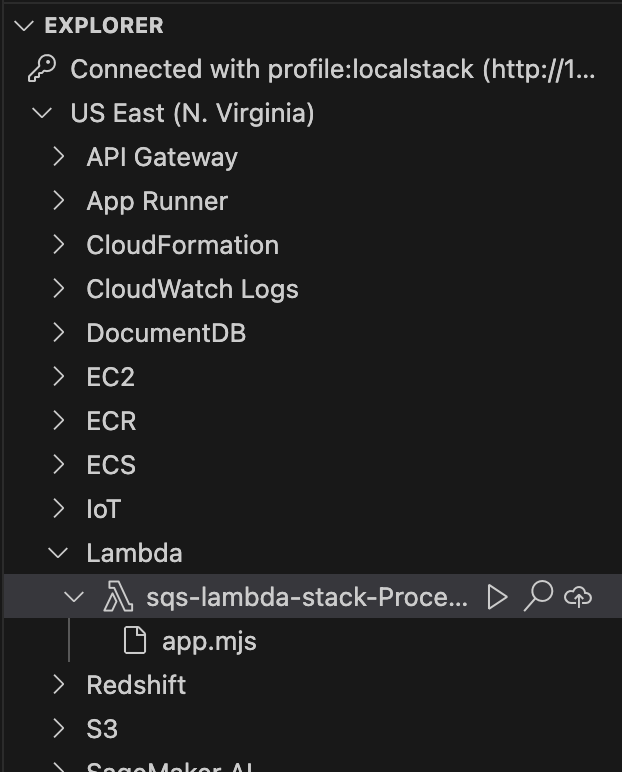
Section titled “Use AWS Toolkit Sample”- Open the AWS Explorer in VS Code.
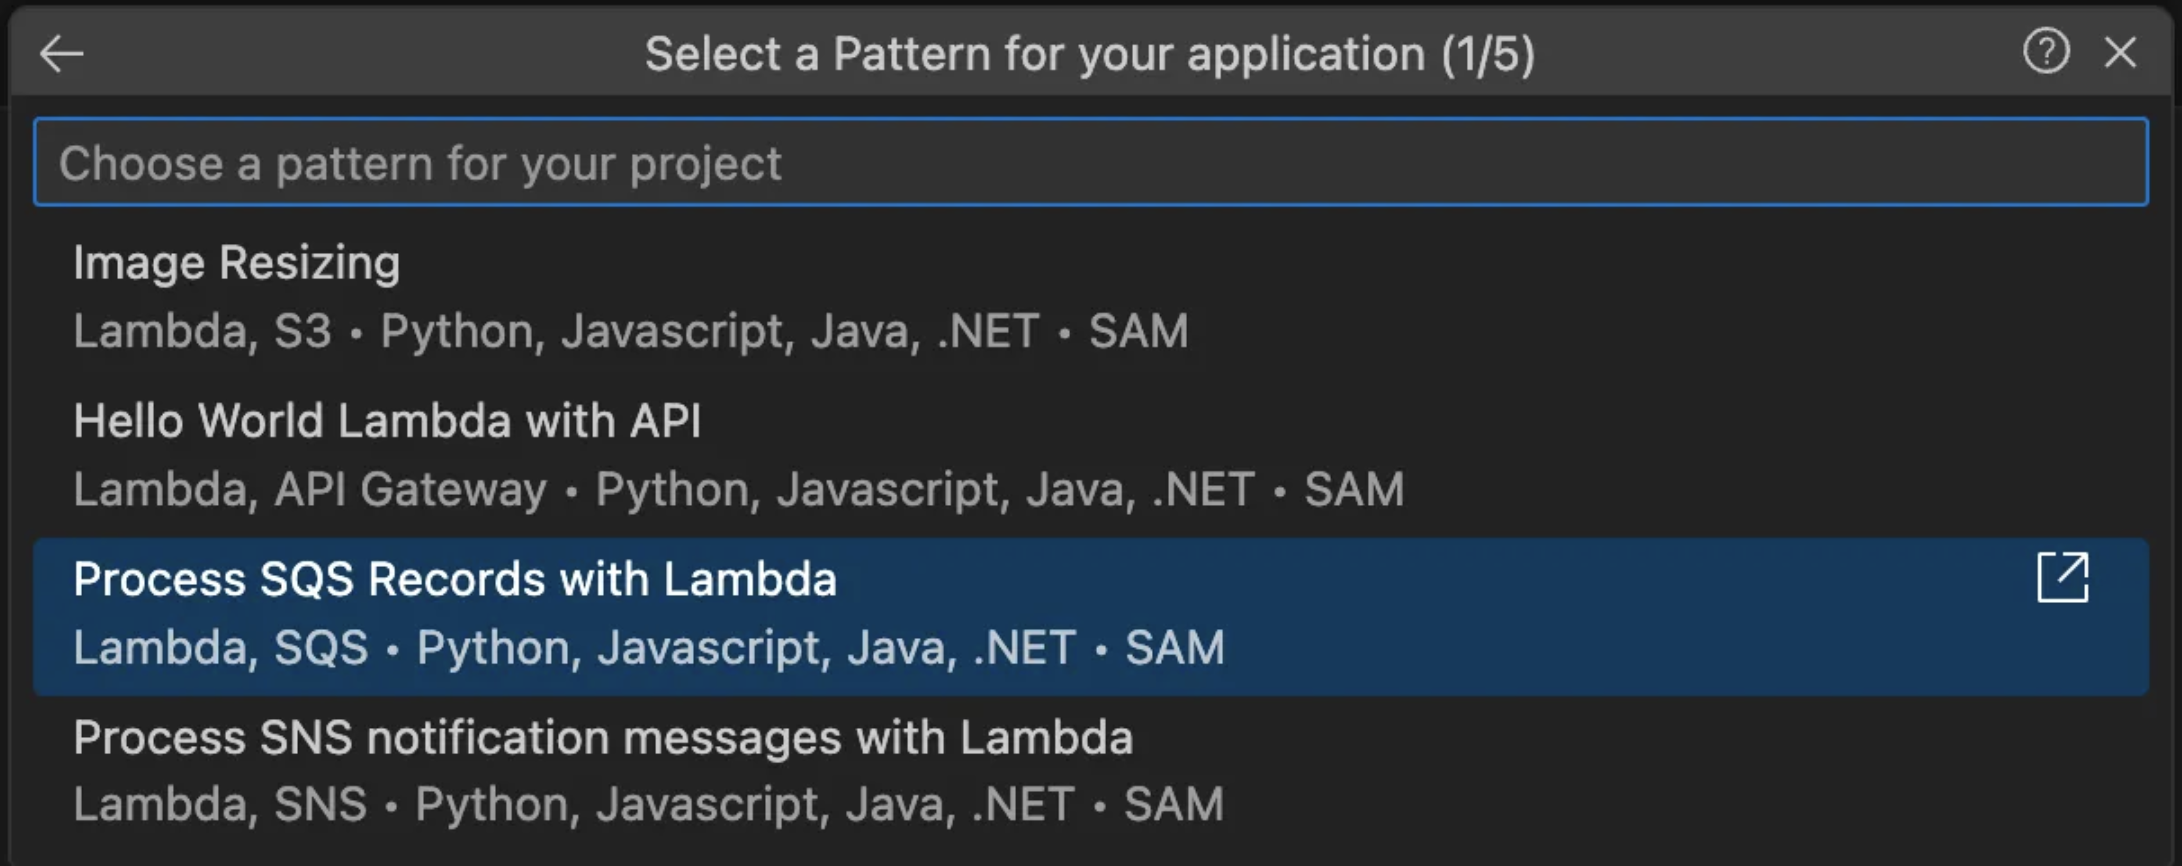
- To install the sample application, select the
...menu in the AWS Explorer view and choose Create application with Serverless template.
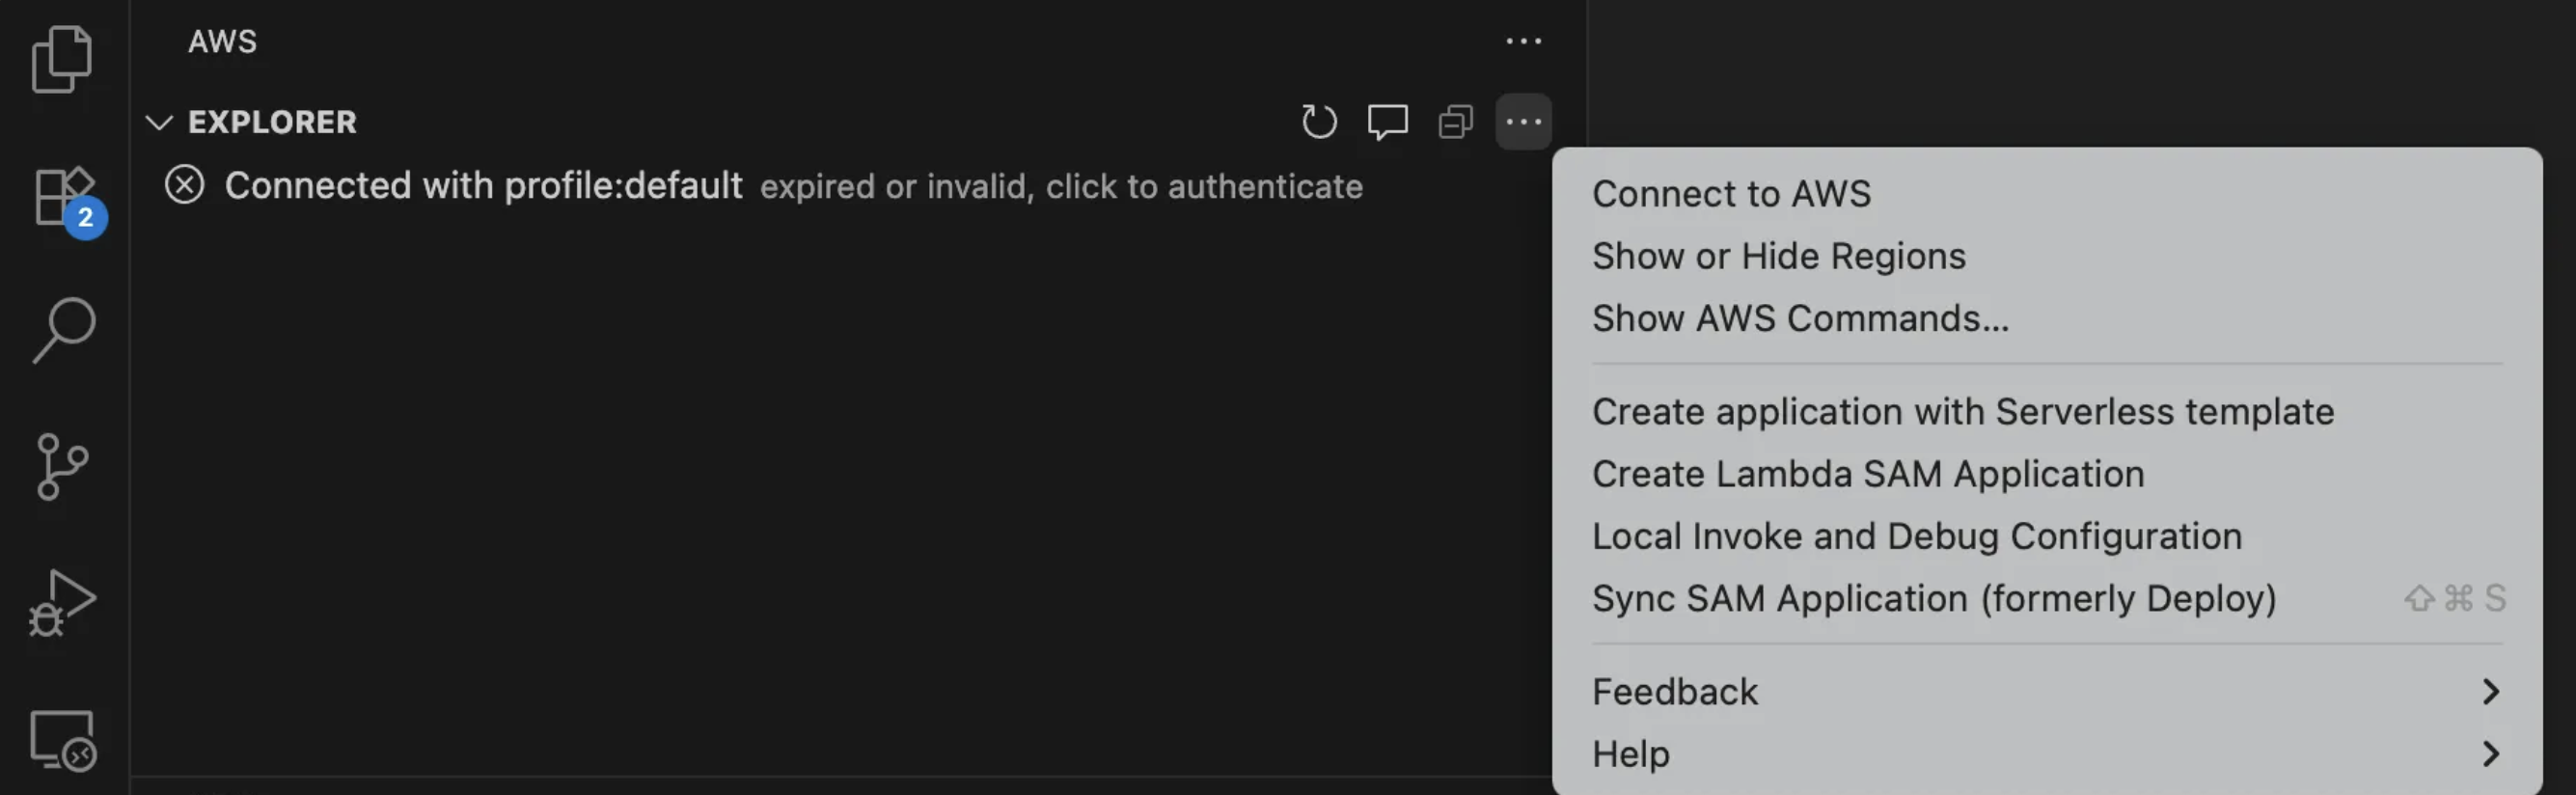
- Choose the “Process SQS Records with Lambda” sample.
-
Select a runtime (Python, Node.js, or Java).
-
Complete the wizard to generate the project.
Deploy and Debug
Section titled “Deploy and Debug”-
Deploy the function:
- Go to Application Builder view
- Click Deploy SAM Application (cloud icon)
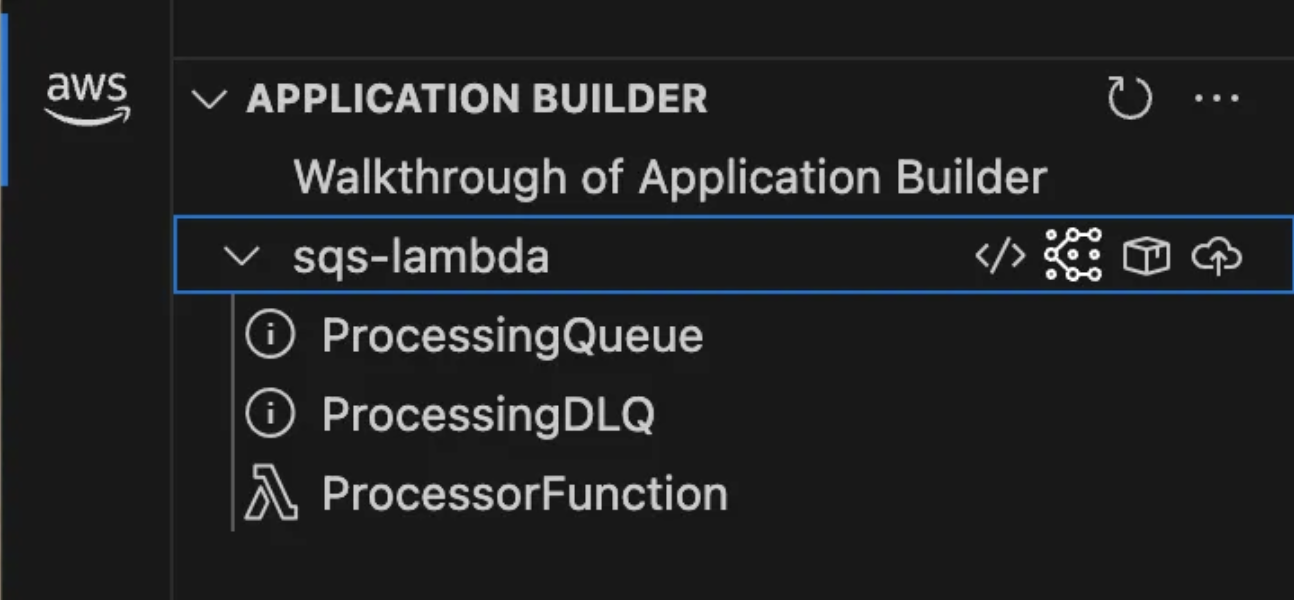
- Follow the wizard to deploy to LocalStack
-
Open Remote Invoke Configuration:
- In AWS Explorer, right-click your deployed Lambda function
- Select Invoke Remotely
-
Enable Remote Debugging:
- In the configuration view, check Remote debugging
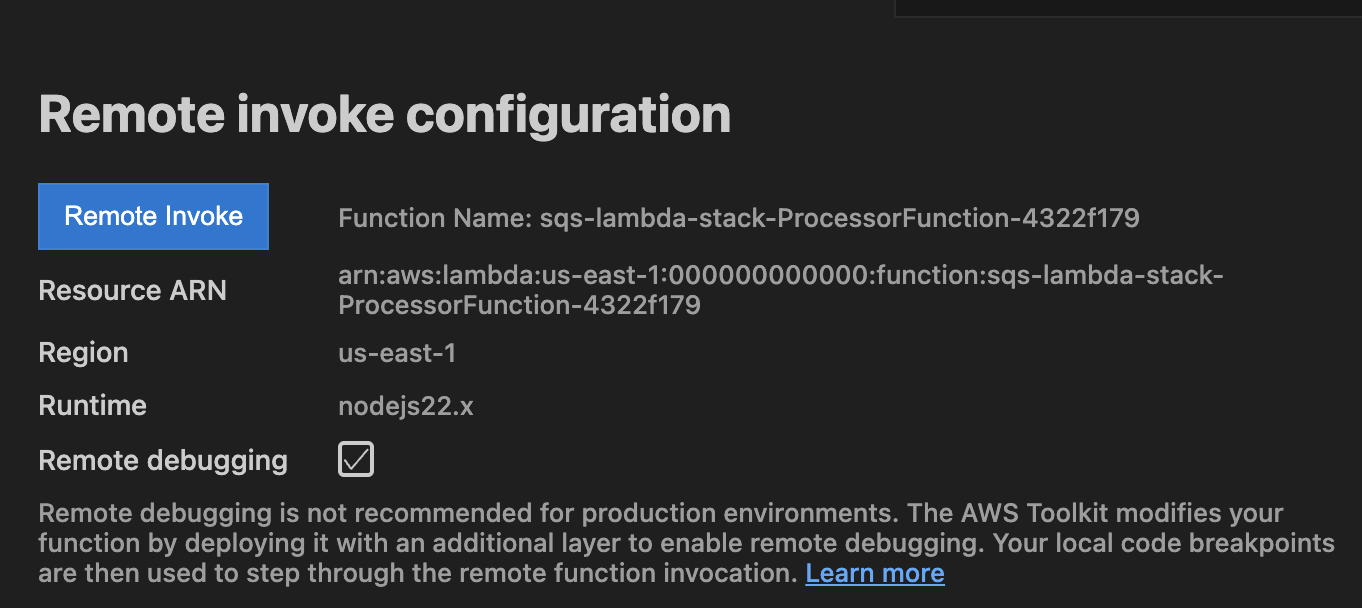
- If prompted, provide the event input (e.g., SQS sample event)
-
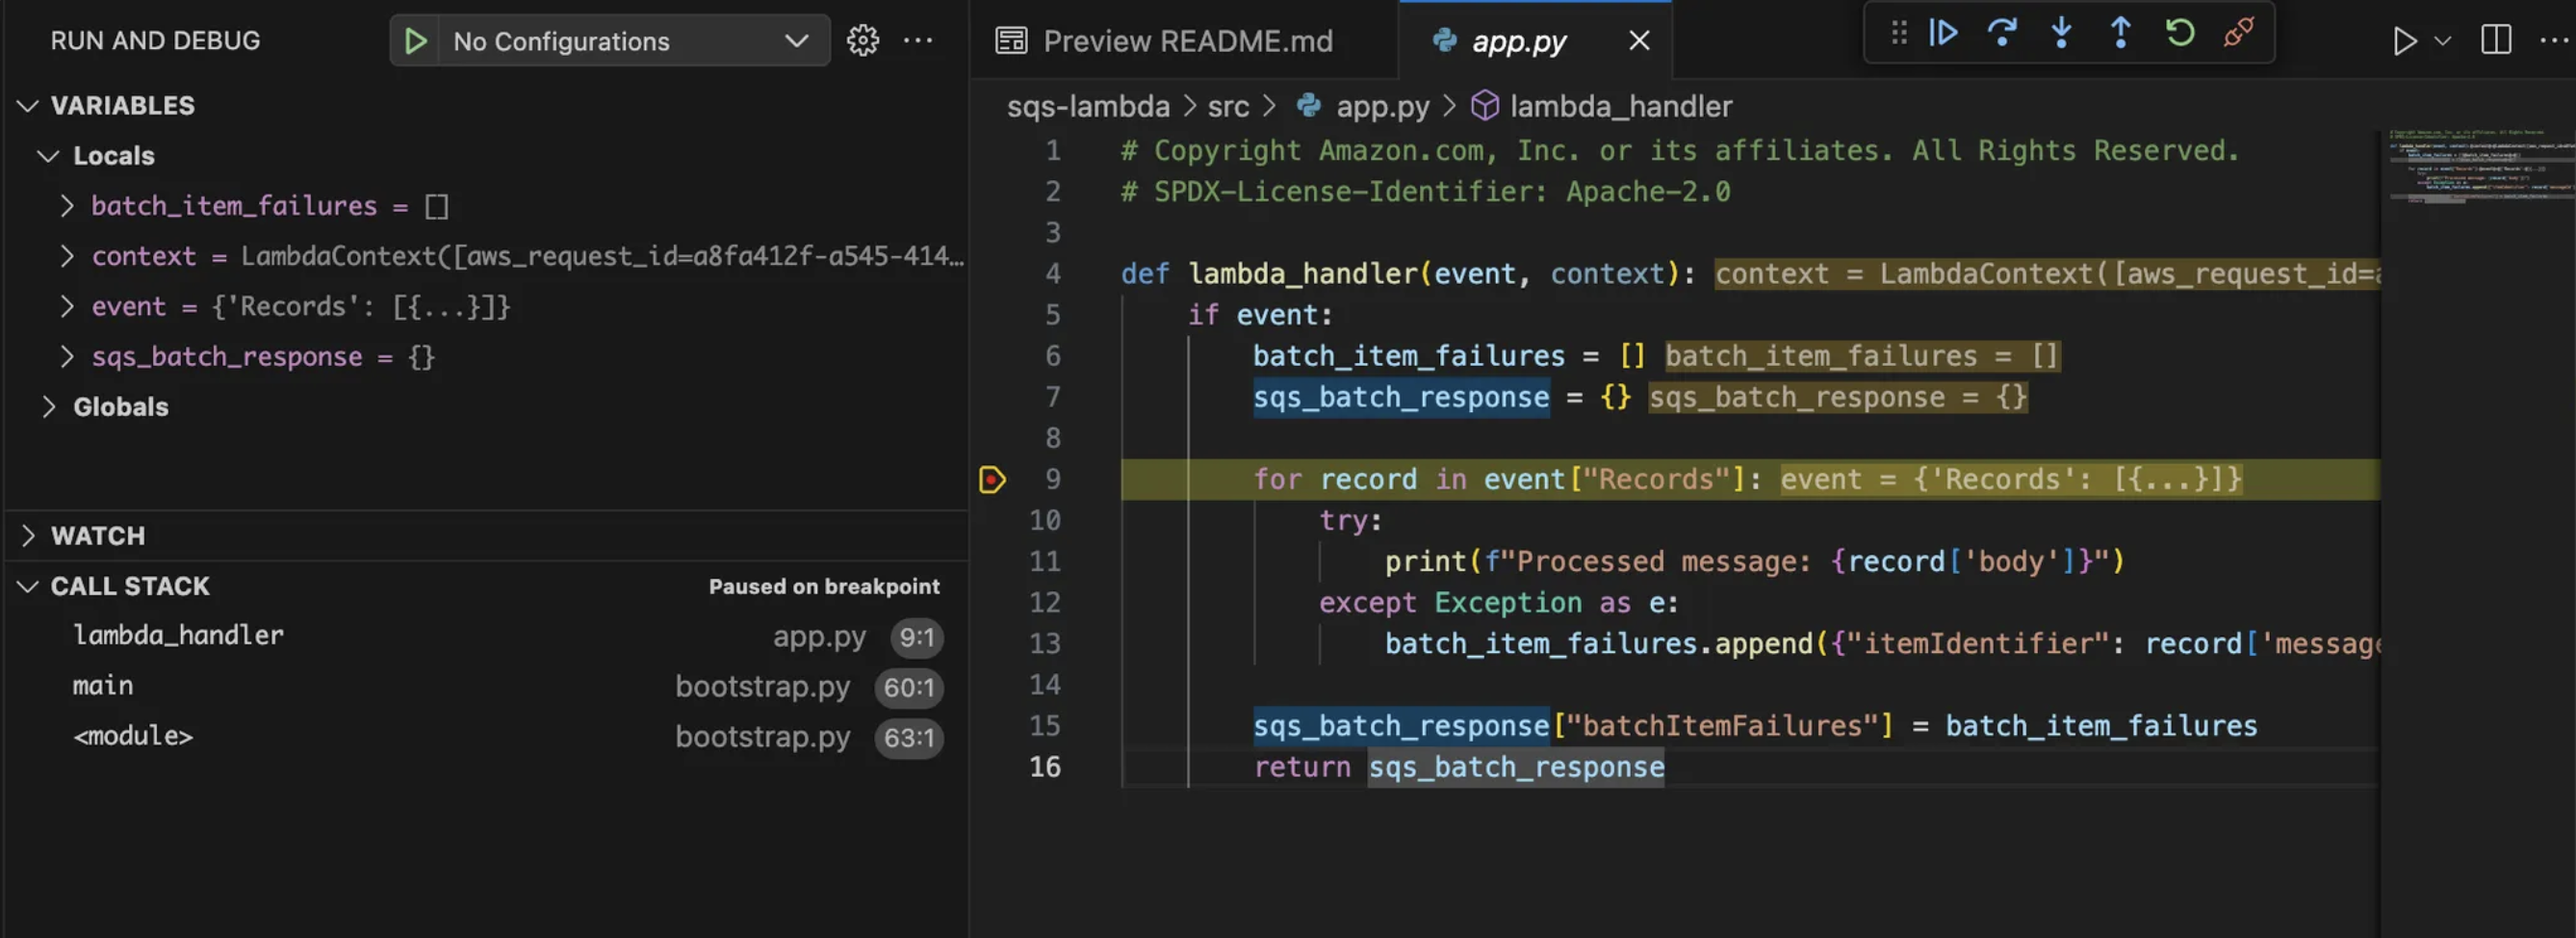
Set Breakpoints and Debug:
- Open your Lambda handler source file
- Set breakpoints in the margin
- Click Remote Invoke
Your Lambda function will execute in LocalStack and pause at your breakpoint. You can inspect variables, step through code, and continue execution.
Debugging TypeScript with Source Maps
Section titled “Debugging TypeScript with Source Maps”To enable source-level debugging for TypeScript:
- Build your TypeScript Lambda with source maps enabled:
tsc --sourceMap true- Ensure the compiled
.jsand.mapfiles are present in the deployment package. - Open the
.tssource file in VS Code, set breakpoints, and proceed as with other runtimes.
Troubleshooting
Section titled “Troubleshooting”UnsupportedLocalStackVersion Error
Section titled “UnsupportedLocalStackVersion Error”If you receive the following error message:
UnsupportedLocalStackVersion: Your current LocalStack version does not support Lambda remote debugging. Update LocalStack and check your license.Here’s how to fix it:
-
Make sure you are running LocalStack for AWS >= v4.8.0
Terminal window docker pull localstack/localstack-pro:latest -
Ensure your auth token is valid and has an assigned license.
- You can re-run the LocalStack Setup Wizard in VS Code to verify.
- Or log into app.localstack.cloud and check your token and license status.
DNS Rebind Protection Issues
Section titled “DNS Rebind Protection Issues”Should downloading the Lambda function code fail, here’s how to fix it:
- Disable DNS rebind protection (see LocalStack DNS docs)
- Use
127.0.0.1instead oflocalhost.localstack.cloud(Automatic setup)- Run the
LocalStack: Configure AWS Profile "localstack"command from the VS Code Command Palette which will auto-configure the correct endpoint.
- Run the
- Use
127.0.0.1instead oflocalhost.localstack.cloud(Manual setup)- Set
LOCALSTACK_HOST=127.0.0.1:4566in~/.localstack/default.env - Update your
endpoint_urlin yourlocalstackprofile located in~/.aws/config
- Set
Lambda Debug Mode (Preview) Pro
Section titled “Lambda Debug Mode (Preview) ”Lambda Debug Mode is a preview feature in LocalStack designed to enhance your Lambda debugging workflows. This feature provides an optimized environment for debugging Lambda functions, ensuring that you have the necessary tools and flexibility to troubleshoot effectively.
Key Features
Section titled “Key Features”- Automatic Timeout Management: Integrates with API Gateway to prevent Lambda function timeouts, giving developers ample time to connect remote debuggers and inspect the function’s behavior.
- Multi-Function Debugging: Supports debugging multiple Lambda functions concurrently.
Enabling Lambda Debug Mode
Section titled “Enabling Lambda Debug Mode”To enable Lambda Debug Mode, set the LAMBDA_DEBUG_MODE environment variable as shown below:
LAMBDA_DEBUG_MODE=1 \LAMBDA_DOCKER_FLAGS='-p 19891:19891' \localstack startWhen enabled, Lambda Debug Mode automatically adjusts timeouts to accommodate debugging needs:
- Lambda Container Startup Timeout: Provides additional time for debugger connection during container creation.
- Lambda Execution Timeout: Extends the execution window, allowing for in-depth remote debugging.
- API Gateway-Lambda Integration Timeout: Increases timeout settings to avoid premature terminations.
Advanced Configuration
Section titled “Advanced Configuration”For further customization, you can use a configuration file.
Specify the path to this file with the LAMBDA_DEBUG_MODE_CONFIG_PATH environment variable, ensuring the
file is mounted into the LocalStack container.
Manually setting LAMBDA_DOCKER_FLAGS is unnecessary when using this configuration.
Here is an example of mounting a debug_config.yaml in your LocalStack container to start your Debug Mode:
LOCALSTACK_LAMBDA_DEBUG_MODE=1 \LOCALSTACK_LAMBDA_DEBUG_MODE_CONFIG_PATH=/tmp/debug_config.yaml \localstack start --volume /path/to/debug-config.yaml:/tmp/lambda_debug_mode_config.yamlservices: localstack: container_name: "${LOCALSTACK_DOCKER_NAME:-localstack-main}" image: localstack/localstack-pro ports: - "127.0.0.1:4566:4566" # LocalStack Gateway - "127.0.0.1:4510-4559:4510-4559" # external services port range - "127.0.0.1:443:443" # LocalStack HTTPS Gateway (Pro) environment: # LocalStack configuration: https://docs.localstack.cloud/references/configuration/ - DEBUG=${DEBUG:-0} - LAMBDA_DEBUG_MODE=1 - LAMBDA_DEBUG_MODE_CONFIG_PATH=/tmp/debug_config.yaml volumes: - "./debug_config.yaml:/tmp/debug_config.yaml" - "${LOCALSTACK_VOLUME_DIR:-./volume}:/var/lib/localstack" - "/var/run/docker.sock:/var/run/docker.sock"Any change to the configuration file on your local filesystem would be automatically picked by the LocalStack container. After debugging a Lambda function, its associated container will automatically stop.
The configuration file should contain a functions block where you can define debug settings
for each specific Lambda function ARN.
Example: Basic Debugging Configuration
Section titled “Example: Basic Debugging Configuration”This example configures Lambda Debug Mode to use port 19891 for the remote debugger.
functions: arn:aws:lambda:eu-central-1:000000000000:function:func-one: debug-port: 19891Example: Disabling Automatic Timeout Handling
Section titled “Example: Disabling Automatic Timeout Handling”In this example, the automatic timeout handling feature is disabled for the specified Lambda function, enforcing the predefined timeouts instead.
functions: arn:aws:lambda:eu-central-1:000000000000:function:func-one: debug-port: 19891 enforce-timeouts: trueHandling Unqualified ARNs
Section titled “Handling Unqualified ARNs”Specifying an unqualified Lambda ARN in the configuration is equivalent to specifying the ARN
with the $LATEST version qualifier.
functions: arn:aws:lambda:eu-central-1:000000000000:function:func-one:$LATEST: debug-port: 19891Debugging Multiple Functions
Section titled “Debugging Multiple Functions”To debug multiple Lambda functions simultaneously, assign a different debug port to each function. Note that this configuration affects the container’s internal debugger port as well, so the debugger port must be set accordingly.
functions: arn:aws:lambda:eu-central-1:000000000000:function:func-one: debug-port: 19891 arn:aws:lambda:eu-central-1:000000000000:function:func-two: debug-port: 19892Debugging Different Versions
Section titled “Debugging Different Versions”You can also debug different versions of the same Lambda function by assigning unique ports to each version.
functions: arn:aws:lambda:eu-central-1:000000000000:function:func-one:1: debug-port: 19891 arn:aws:lambda:eu-central-1:000000000000:function:func-two:2: debug-port: 19892Manual Lambda Debugging (Legacy)
Section titled “Manual Lambda Debugging (Legacy)”Debugging Python Lambda functions
Section titled “Debugging Python Lambda functions”Lambda functions debugging used to be a difficult task. LocalStack changes that with the same local code mounting functionality that also helps you to iterate quickly over your function code.
Debugging a Python Lambda in Visual Studio Code
Section titled “Debugging a Python Lambda in Visual Studio Code”Configure LocalStack for VS Code remote Python debugging
Section titled “Configure LocalStack for VS Code remote Python debugging”First, make sure that LocalStack is started with the following configuration (see the Configuration docs for more information):
LAMBDA_DOCKER_FLAGS='-p 19891:19891' localstack startPreparing your code
Section titled “Preparing your code”For providing the debug server, we use debugpy
inside the Lambda function code.
In general, all you need is the following code
fragment placed inside your handler code:
import debugpydebugpy.listen(("0.0.0.0", 19891))debugpy.wait_for_client() # blocks execution until client is attachedFor extra convenience, you can use the wait_for_debug_client function from our example.
It implements the above-mentioned start of the debug server and also adds an automatic cancellation of the wait task if the debug client (i.e. VSCode) doesn’t connect.
def wait_for_debug_client(timeout=15): """Utility function to enable debugging with Visual Studio Code""" import time, threading import sys, glob sys.path.append(glob.glob(".venv/lib/python*/site-packages")[0]) import debugpy
debugpy.listen(("0.0.0.0", 19891)) class T(threading.Thread): daemon = True def run(self): time.sleep(timeout) print("Canceling debug wait task ...") debugpy.wait_for_client.cancel() T().start() print("Waiting for client to attach debugger ...") debugpy.wait_for_client()Configuring Visual Studio Code for remote Python debugging
Section titled “Configuring Visual Studio Code for remote Python debugging”For attaching the debug server from Visual Studio Code, you need to add a run configuration.
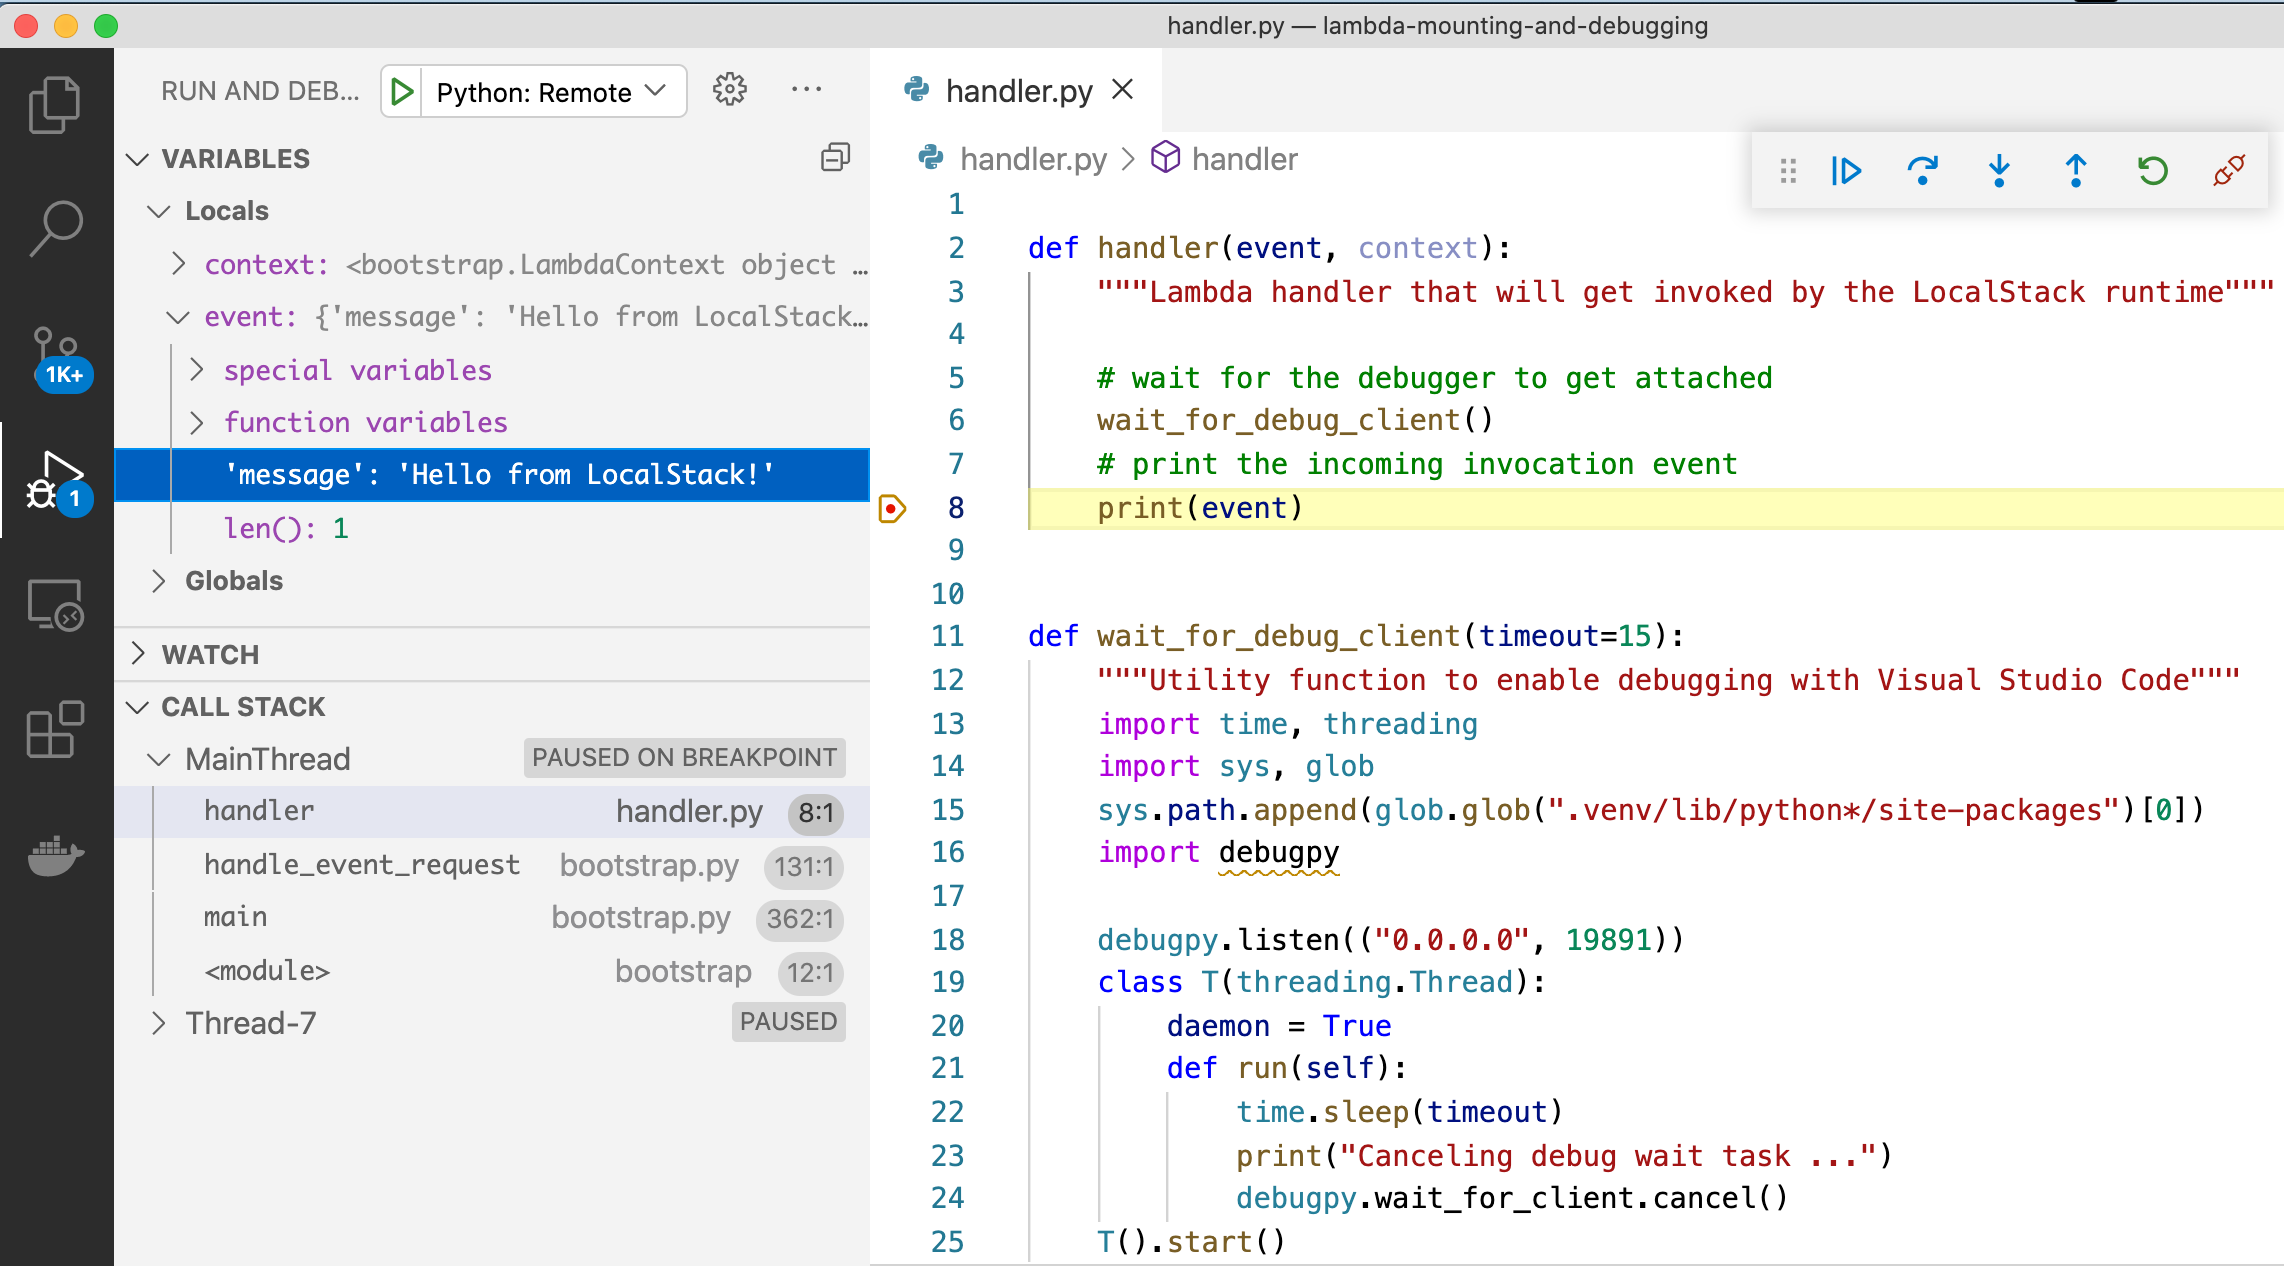
{ "version": "0.2.0", "configurations": [ { "name": "Python: Remote Attach", "type": "python", "request": "attach", "connect": { "host": "localhost", "port": 19891 }, "pathMappings": [ { "localRoot": "${workspaceFolder}", "remoteRoot": "." } ] } ]}In the next step we create our function. In order to debug the function in Visual Studio Code, run the preconfigured remote debugger, which will wait about 15 seconds as defined above, and then invoke the function. Make sure to set a breakpoint in the Lambda handler code first, which can then later be inspected.
The screenshot below shows the triggered breakpoint with our 'Hello from LocalStack!' in the variable inspection view:
Current Limitations
Section titled “Current Limitations”Due to the ports published by the lambda container for the debugger, you can currently only debug one Lambda at a time. Due to the port publishing, multiple concurrently running lambda environments are not supported.
Debugging a Python Lambda in PyCharm Professional
Section titled “Debugging a Python Lambda in PyCharm Professional”Please be aware that remote debugging in PyCharm is only available in the Professional version.
You do not need to change the LAMBDA_DOCKER_FLAGS when debugging with PyCharm Professional.
Configuring PyCharm for remote Python debugging
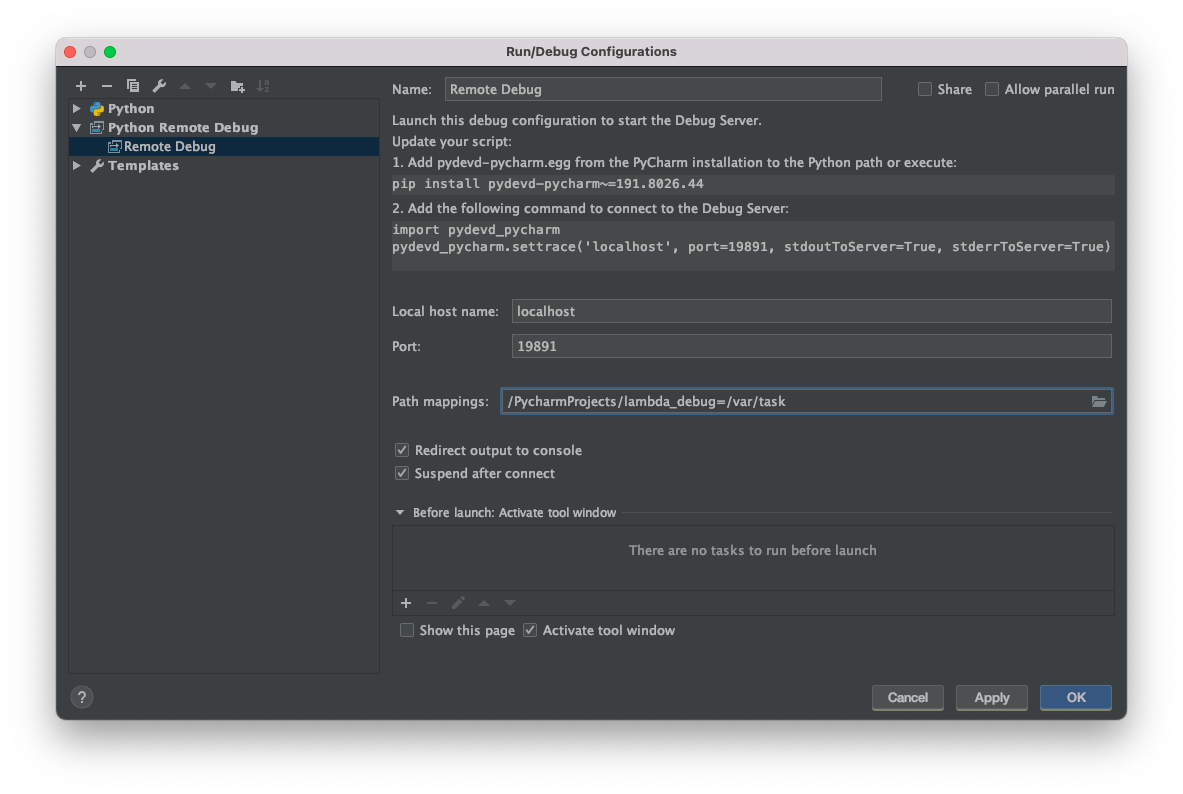
Section titled “Configuring PyCharm for remote Python debugging”You can follow the steps in the official docs, which will come down to:
- Create a debug configuration with the IDE host name
localhostand the debug port19891. - Add path mapping with your project files on the host and map it to the remote directory
/var/task. - Copy the
pip installcommand, and make sure to install the correctpydevd-pycharmversion for your PyCharm IDE.
Preparing your code
Section titled “Preparing your code”PyCharm provides its own debugging package, called pydevd-pycharm.
Essentially, you will add the following code to your lambda:
import pydevd_pycharmpydevd_pycharm.settrace('host.docker.internal', port=19891, stdoutToServer=True, stderrToServer=True)The host.docker.internal is a special DNS name by Docker and will make sure that the lambda running in the docker can connect to PyCharm running on your Localhost.
You can use the wait_for_debug_client and add it to your lambda (please adapt the path to your venv directory if necessary):
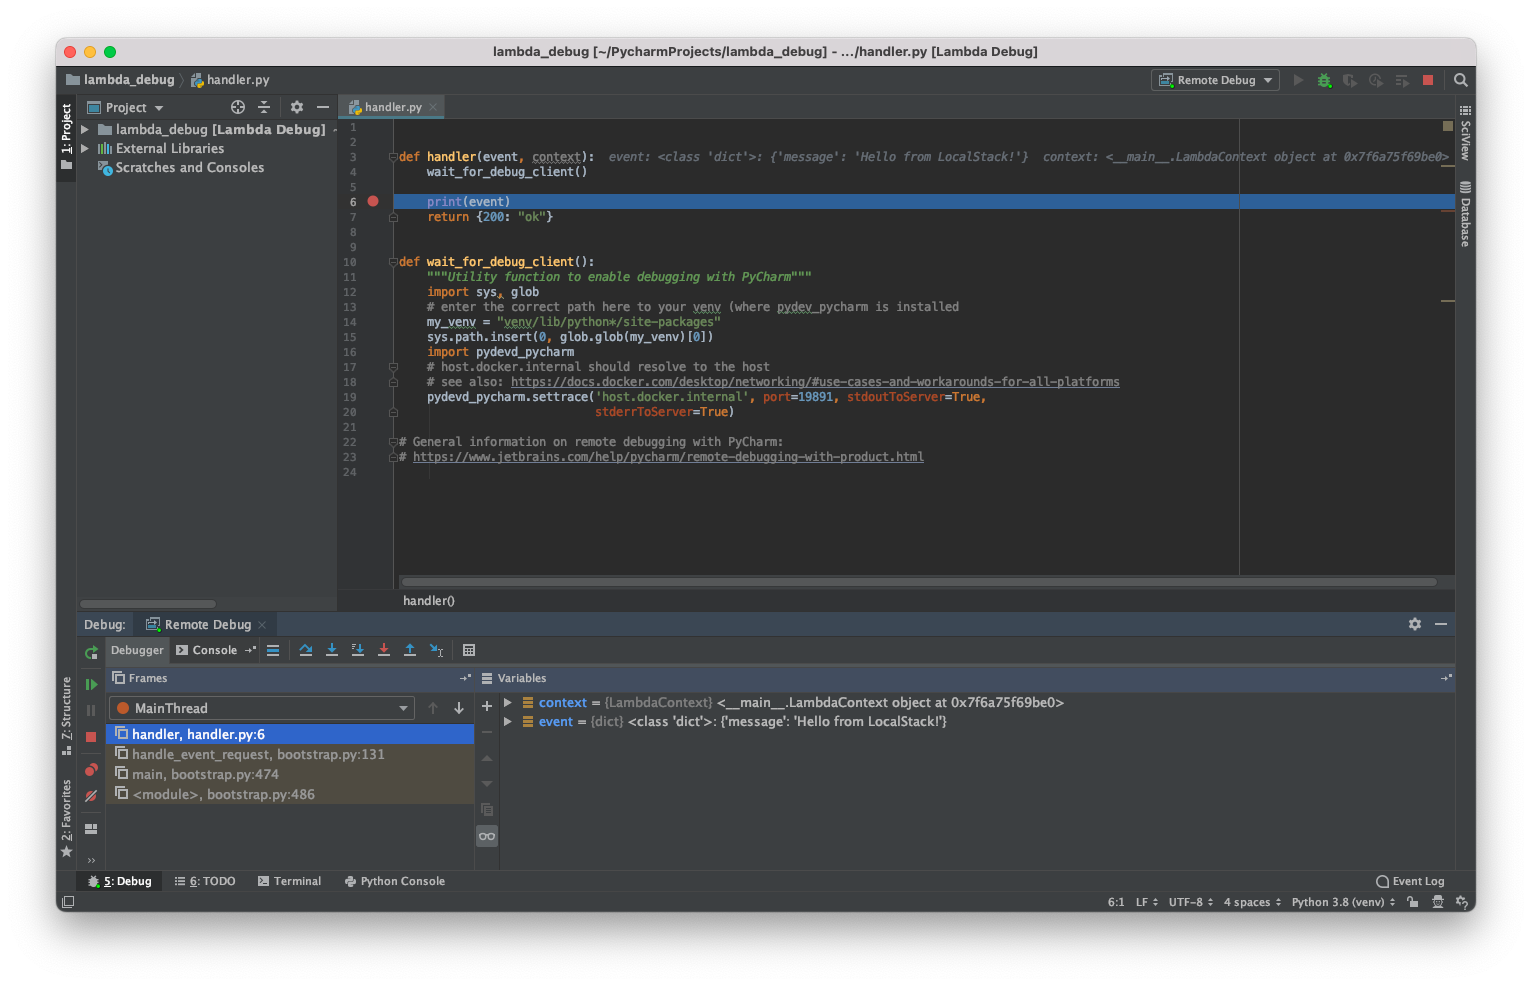
def wait_for_debug_client(): """Utility function to enable debugging with PyCharm""" import sys, glob # enter the correct path here to your venv (where pydev_pycharm is installed my_venv = "venv/lib/python*/site-packages" sys.path.insert(0, glob.glob(my_venv)[0]) import pydevd_pycharm # host.docker.internal should resolve to the host # see also: https://docs.docker.com/desktop/networking#use-cases-and-workarounds-for-all-platforms pydevd_pycharm.settrace('host.docker.internal', port=19891, stdoutToServer=True, stderrToServer=True)In the next step we create our function. In order to debug the function in PyCharm set a breakpoint in your function, run the Remote Debug configuration and then invoke the function.
Creating the Lambda function
Section titled “Creating the Lambda function”To create the Lambda function, you just need to take care of two things:
- Deploy the function via an S3 Bucket.
You need to use the magic variable
hot-reloadas the bucket name. - Set the S3 key to the path of the directory your lambda function resides in. The handler is then referenced by the filename of your lambda code and the function in that code that should be invoked.
Using the AWS CLI, this would be:
awslocal lambda create-function --function-name my-cool-local-function \ --code S3Bucket="hot-reload",S3Key="$(pwd)/" \ --handler handler.handler \ --runtime python3.13 \ --timeout 150 \ --role arn:aws:iam::000000000000:role/lambda-roleWe can quickly verify that it works by invoking it with a simple payload:
awslocal lambda invoke --function-name my-cool-local-function \ --payload '{"message": "Hello from LocalStack!"}' \ output.txtawslocal lambda invoke --function-name my-cool-local-function \ --cli-binary-format raw-in-base64-out \ --payload '{"message": "Hello from LocalStack!"}' \ output.txtDebugging JVM Lambda functions
Section titled “Debugging JVM Lambda functions”Configure LocalStack and your Lambda function for remote JVM debugging
Section titled “Configure LocalStack and your Lambda function for remote JVM debugging”Set LAMBDA_DOCKER_FLAGS to export the 5050 (you can use any other port of your choice) port which your IDE debugger will connect to.
services: localstack: ... environment: ... - LAMBDA_DOCKER_FLAGS=-p 127.0.0.1:5050:5050When creating your Lambda function, set the _JAVA_OPTIONS environment variable like so:
awslocal lambda create-function --function-name debugfunc \ --zip-file fileb://java-handler.zip \ --handler myindex.handler \ --runtime java8.al2 \ --timeout 150 \ --role arn:aws:iam::000000000000:role/lambda-role \ --environment '{"Variables": {"_JAVA_OPTIONS": "-Xshare:off -agentlib:jdwp=transport=dt_socket,server=y,suspend=y,address=0.0.0.0:5050"}}'Note the suspend=y option here, it will delay code execution until the debugger is attached to the debugger server.
If you want to change that, simply switch to suspend=n.
By default the runtime environment for Java will set -Xshare: on, so we’ll have to disable it here again.
Your IDE might show you the listen address as *:5050, but please note that this only works for Java 9+.
Configuring IntelliJ IDEA for remote JVM debugging
Section titled “Configuring IntelliJ IDEA for remote JVM debugging”Open the Run/Debug Configurations window and create a new Shell Script with
the following content:
while [[ -z $(docker ps | grep :5050) ]]; do sleep 1; done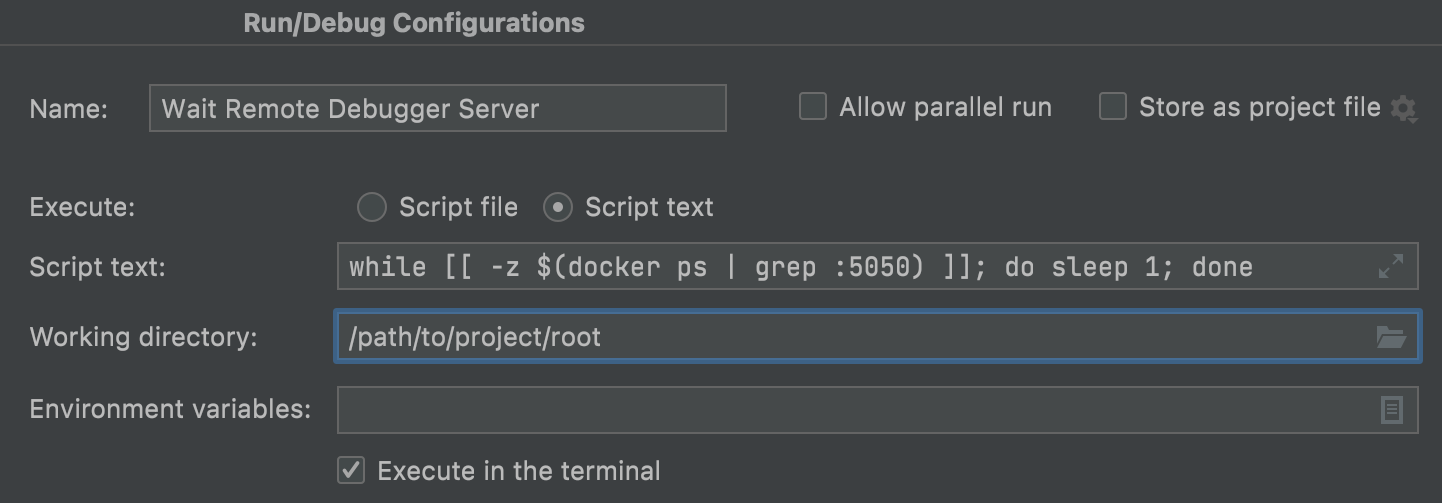
This shell script should simplify the process a bit since the debugger server is not immediately available (only once Lambda container is up).
Then create a new Remote JVM Debug configuration and use the script from above as a Before launch target:
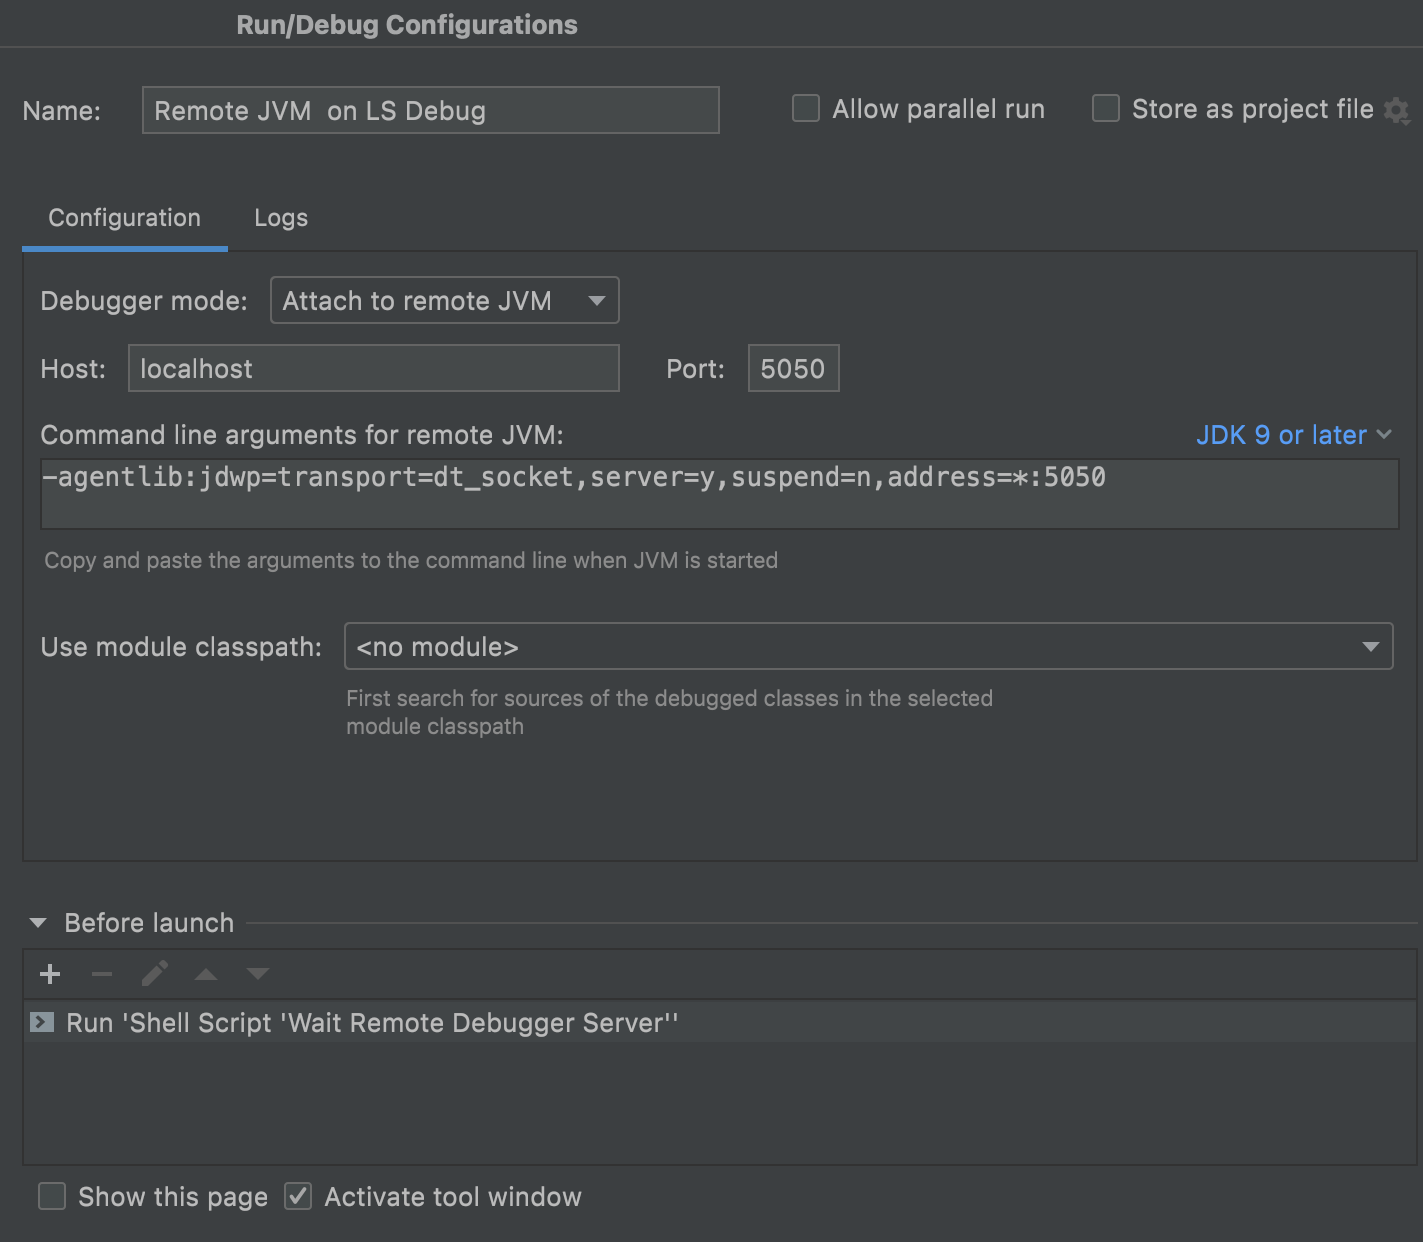
Now to debug your Lambda function, simply click on the Debug icon with Remote JVM on LS Debug configuration selected, and then invoke your Lambda function.
Alternative setup for IntelliJ IDEA
Section titled “Alternative setup for IntelliJ IDEA”The debugger can also act as a server by changing the drop-down “Debugger mode” to “Listen to remote JVM”.
In this case you should not set LAMBDA_DOCKER_FLAGS since the port will be exposed on your host instead of the Lambda container.
Compared to the previous setup the “Wait Remote Debugger Server” run configuration should also be removed and instead tick the mark at “Auto restart” after switching to the “Listen to remote JVM” mode.
For the Lambda function you will have to adjust the environment variable to "_JAVA_OPTIONS": "-Xshare:off -agentlib:jdwp=transport=dt_socket,server=n,address=172.17.0.1:5050,suspend=y,onuncaught=n".
Notice the address=172.17.0.1:5050.
Here we tell the Lambda function to connect to port 5050 on 172.17.0.1.
When using Docker desktop you might have to set this to address=host.docker.internal:5050 instead.
Configuring Visual Studio Code for remote JVM debugging
Section titled “Configuring Visual Studio Code for remote JVM debugging”Make sure you installed the following extensions:
Add a new task by creating/modifying the .vscode/tasks.json file:
{ "version": "2.0.0", "tasks": [ { "label": "Wait Remote Debugger Server", "type": "shell", "command": "while [[ -z $(docker ps | grep :5050) ]]; do sleep 1; done; sleep 1;" } ]}Create a new launch.json file or edit an existing one from the Run and Debug tab,
then add the following configuration:
{ "version": "0.2.0", "configurations": [ { "type": "java", "name": "Remote JVM on LS Debug", "projectRoot": "${workspaceFolder}", "request": "attach", "hostName": "localhost", "preLaunchTask": "Wait Remote Debugger Server", "port": 5050 } ]}Now to debug your lambda function, click on the Debug icon with
Remote JVM on LS Debug configuration selected, and then invoke your
lambda function.
Debugging Node.js Lambda functions
Section titled “Debugging Node.js Lambda functions”Configure LocalStack for remote Node.js debugging
Section titled “Configure LocalStack for remote Node.js debugging”Set the LAMBDA_DOCKER_FLAGS to enable the debugger using NODE_OPTIONS:
services: localstack: ... environment: ... - LAMBDA_DOCKER_FLAGS=-e NODE_OPTIONS=--inspect-brk=0.0.0.0:9229 -p 9229:9229Configuring Visual Studio Code for remote Node.js debugging
Section titled “Configuring Visual Studio Code for remote Node.js debugging”Add a new task by creating/modifying the .vscode/tasks.json file:
{ "version": "2.0.0", "tasks": [ { "label": "Wait Remote Debugger Server", "type": "shell", "command": "while [[ -z $(docker ps | grep :9229) ]]; do sleep 1; done; sleep 1;" } ]}Create a new launch.json file or edit an existing one from the Run and Debug tab,
then add the following configuration:
{ "version": "0.2.0", "configurations": [ { "address": "127.0.0.1", "localRoot": "${workspaceFolder}", "name": "Attach to Remote Node.js", "port": 9229, "remoteRoot": "/var/task/", "request": "attach", "type": "node", "preLaunchTask": "Wait Remote Debugger Server" }, ]}A simple example of a Node.js lambda, myindex.js could look like this:
exports.handler = async (event) => { console.log(event); const response = { statusCode: 200, body: "ok", }; return response;};Create the lambda function using:
awslocal lambda create-function --function-name func1 \ --code S3Bucket="hot-reload",S3Key="$(pwd)/" \ --handler myindex.handler \ --runtime nodejs14.x \ --timeout 150 \ --role arn:aws:iam::000000000000:role/lambda-roleNow to debug your lambda function, click on the Debug icon with
Attach to Remote Node.js configuration selected, and then invoke your
lambda function:
awslocal lambda invoke --function-name func1 \ --payload '{"hello":"world"}' \ output.txtawslocal lambda invoke --function-name func1 \ --cli-binary-format raw-in-base64-out \ --payload '{"hello":"world"}' \ output.txt