CloudWatch
Introduction
Section titled “Introduction”CloudWatch is a comprehensive monitoring and observability service that Amazon Web Services (AWS) provides. It allows you to collect and track metrics, collect and monitor log files, and set alarms. CloudWatch provides valuable insights into your AWS resources, applications, and services, enabling you to troubleshoot issues, optimize performance, and make informed decisions.
LocalStack allows you to use CloudWatch APIs on your local machine to create and manage CloudWatch resources, such as custom metrics, alarms, and log groups, for local development and testing purposes. The supported APIs are available on our API Coverage section, which provides information on the extent of CloudWatch’s integration with LocalStack.
Getting started
Section titled “Getting started”This guide is designed for users new to CloudWatch and assumes basic knowledge of the AWS CLI and our awslocal wrapper script.
Start your LocalStack container using your preferred method and deploy your Lambda functions that will generate some logs.
You can get the name for your Lambda Functions using the ListFunctions API.
Fetch the Log Groups using the DescribeLogGroups API.
Run the following command to get the Log Group name:
awslocal logs describe-log-groups{ "logGroups": [ { "logGroupName": "/aws/lambda/serverless-local-hello", "creationTime": 1683009865348, "metricFilterCount": 0, "arn": "arn:aws:logs:us-east-1:000000000000:log-group:/aws/lambda/serverless-local-hello:*", "storedBytes": 262 }, { "logGroupName": "/aws/lambda/serverless-local-hello2", "creationTime": 1683009865420, "metricFilterCount": 0, "arn": "arn:aws:logs:us-east-1:000000000000:log-group:/aws/lambda/serverless-local-hello2:*", "storedBytes": 262 } ]}Get the log streams for the Log Group using the DescribeLogStreams API.
Run the following command to get the Log Stream name:
awslocal logs describe-log-streams \ --log-group-name /aws/lambda/serverless-local-hello{ "logStreams": [ { "logStreamName": "2023/05/02/[$LATEST]853a59d0767cfaf10d6b29a6790d8b03", "creationTime": 1683009968958, "firstEventTimestamp": 1683009968920, "lastEventTimestamp": 1683009968945, "lastIngestionTime": 1683009968979, "uploadSequenceToken": "1", "arn": "arn:aws:logs:us-east-1:000000000000:log-group:/aws/lambda/serverless-local-hello:log-stream:2023/05/02/[$LATEST]853a59d0767cfaf10d6b29a6790d8b03", "storedBytes": 262 } ]}You can now fetch the log events using the GetLogEvents API.
Run the following command to get the logs:
awslocal logs get-log-events \ --log-group-name '/aws/lambda/serverless-local-hello' --log-stream-name '2023/05/02/[$LATEST]853a59d0767cfaf10d6b29a6790d8b03'{ "events": [ { "timestamp": 1683009968920, "message": "START RequestId: 71712856-9f41-4d22-827c-e3883f799f25 Version: $LATEST", "ingestionTime": 1683009968979 }, { "timestamp": 1683009968932, "message": "END RequestId: 71712856-9f41-4d22-827c-e3883f799f25", "ingestionTime": 1683009968979 }, { "timestamp": 1683009968945, "message": "REPORT RequestId: 71712856-9f41-4d22-827c-e3883f799f25\tDuration: 1.27 ms\tBilled Duration: 2 ms\tMemory Size: 1024 MB\tMax Memory Used: 1024 MB\t", "ingestionTime": 1683009968979 } ], "nextForwardToken": "f/00000000000000000000000000000000000000000000000000000002", "nextBackwardToken": "b/00000000000000000000000000000000000000000000000000000000"}Metric Alarms
Section titled “Metric Alarms”Alarms in CloudWatch are crucial in monitoring specific data thresholds and automating actions based on those thresholds. To learn more about how alarms are evaluated in general, please refer to the AWS documentation.
In LocalStack, you can use metric-alarm evaluation, explicitly utilizing the statistic and comparison-operator functionalities. These features enable you to define and evaluate alarms based on various statistical calculations and comparison operators.
Metric Alarm Examples
Section titled “Metric Alarm Examples”Metric alarms in CloudWatch allow you to evaluate the state of a metric by analyzing its data points over a specified period. With metric alarms, you can create customized thresholds and define actions based on the metric’s behavior.
To get started with creating an alarm in LocalStack using the awslocal integration, use the following command:
awslocal cloudwatch put-metric-alarm \ --alarm-name my-alarm \ --metric-name Orders \ --namespace test \ --threshold 1 \ --comparison-operator LessThanThreshold \ --evaluation-periods 1 \ --period 30 \ --statistic Minimum \ --treat-missing notBreachingTo monitor the status of the alarm, open a separate terminal and execute the following command:
watch "awslocal cloudwatch describe-alarms --alarm-names my-alarm | jq '.MetricAlarms[0].StateValue'"Afterward, you can add some data that will cause a breach and set the metric-alarm state to ALARM using the following command:
awslocal cloudwatch put-metric-data \ --namespace test \ --metric-data '[{"MetricName": "Orders", "Value": -1}]'Within a few seconds, the alarm state should change to ALARM, and eventually, it will go back to OK as we configured it to treat missing data points as not breaching.
This allows you to observe how the alarm behaves in response to the provided data.
Metric Alarm with Action
Section titled “Metric Alarm with Action”When the state of an alarm changes, actions can be triggered accordingly.
In LocalStack, you can configure alarm-actions, ok-actions, and insufficient-data-actions to specify the actions to be taken.
Currently, only SNS Topics are supported as the target for these actions, and it’s important to note that the topic must be created beforehand.
Here’s an example demonstrating how to set up an alarm that sends a message to the specified topic when entering the ALARM state.
Make sure to replace <topic-arn> with the valid ARN of an existing SNS topic.
awslocal cloudwatch put-metric-alarm \ --alarm-name my-alarm \ --metric-name Orders \ --namespace test \ --threshold 50 \ --comparison-operator GreaterThanThreshold \ --evaluation-periods 1 \ --period 300 \ --statistic Maximum \ --treat-missing notBreaching \ --alarm-actions <topic-arn>By executing this command, you’ll create an alarm named my-alarm that monitors the Orders metric in the test namespace.
If the metric value exceeds the threshold of 50 (using the GreaterThanThreshold operator) during a single evaluation period of 300 seconds, the alarm will trigger the specified action on the provided SNS topic.
Current Limitations
Section titled “Current Limitations”The following CloudWatch Metrics are not supported:
- Anomaly detection
- Metric streams
- Extended statistics
In addition, the unit values specified in the alarm are ignored, and Composite alarms are not evaluated.
Supported Service Integrations
Section titled “Supported Service Integrations”LocalStack supports the following AWS services for integration with CloudWatch metrics:
- SQS: Supports
Approximate*metrics,NumberOfMessagesSent, and other metrics triggered by events such as message received or sending. - Lambda: Supports
InvocationsandErrorsmetrics.
Resource Browser
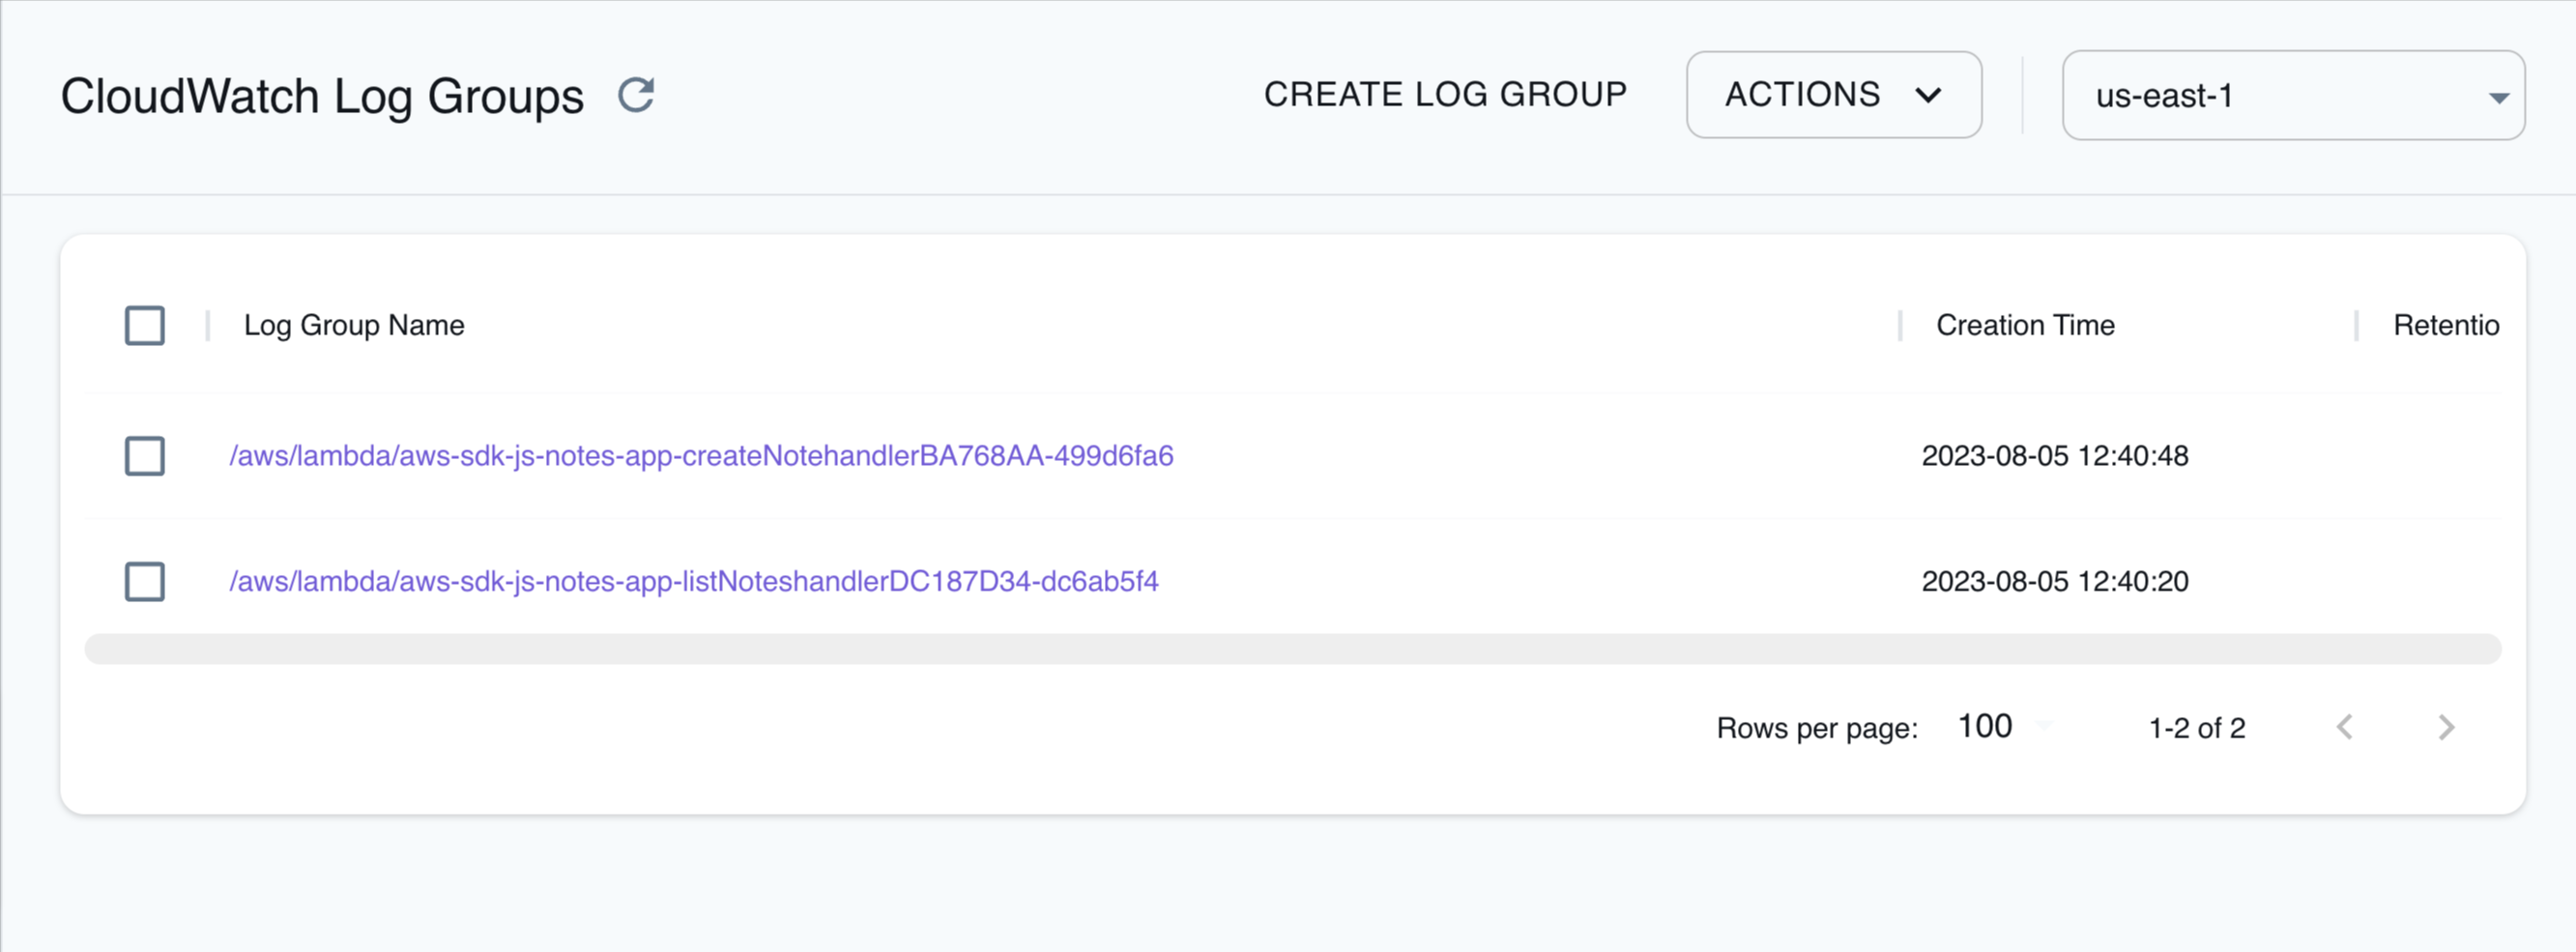
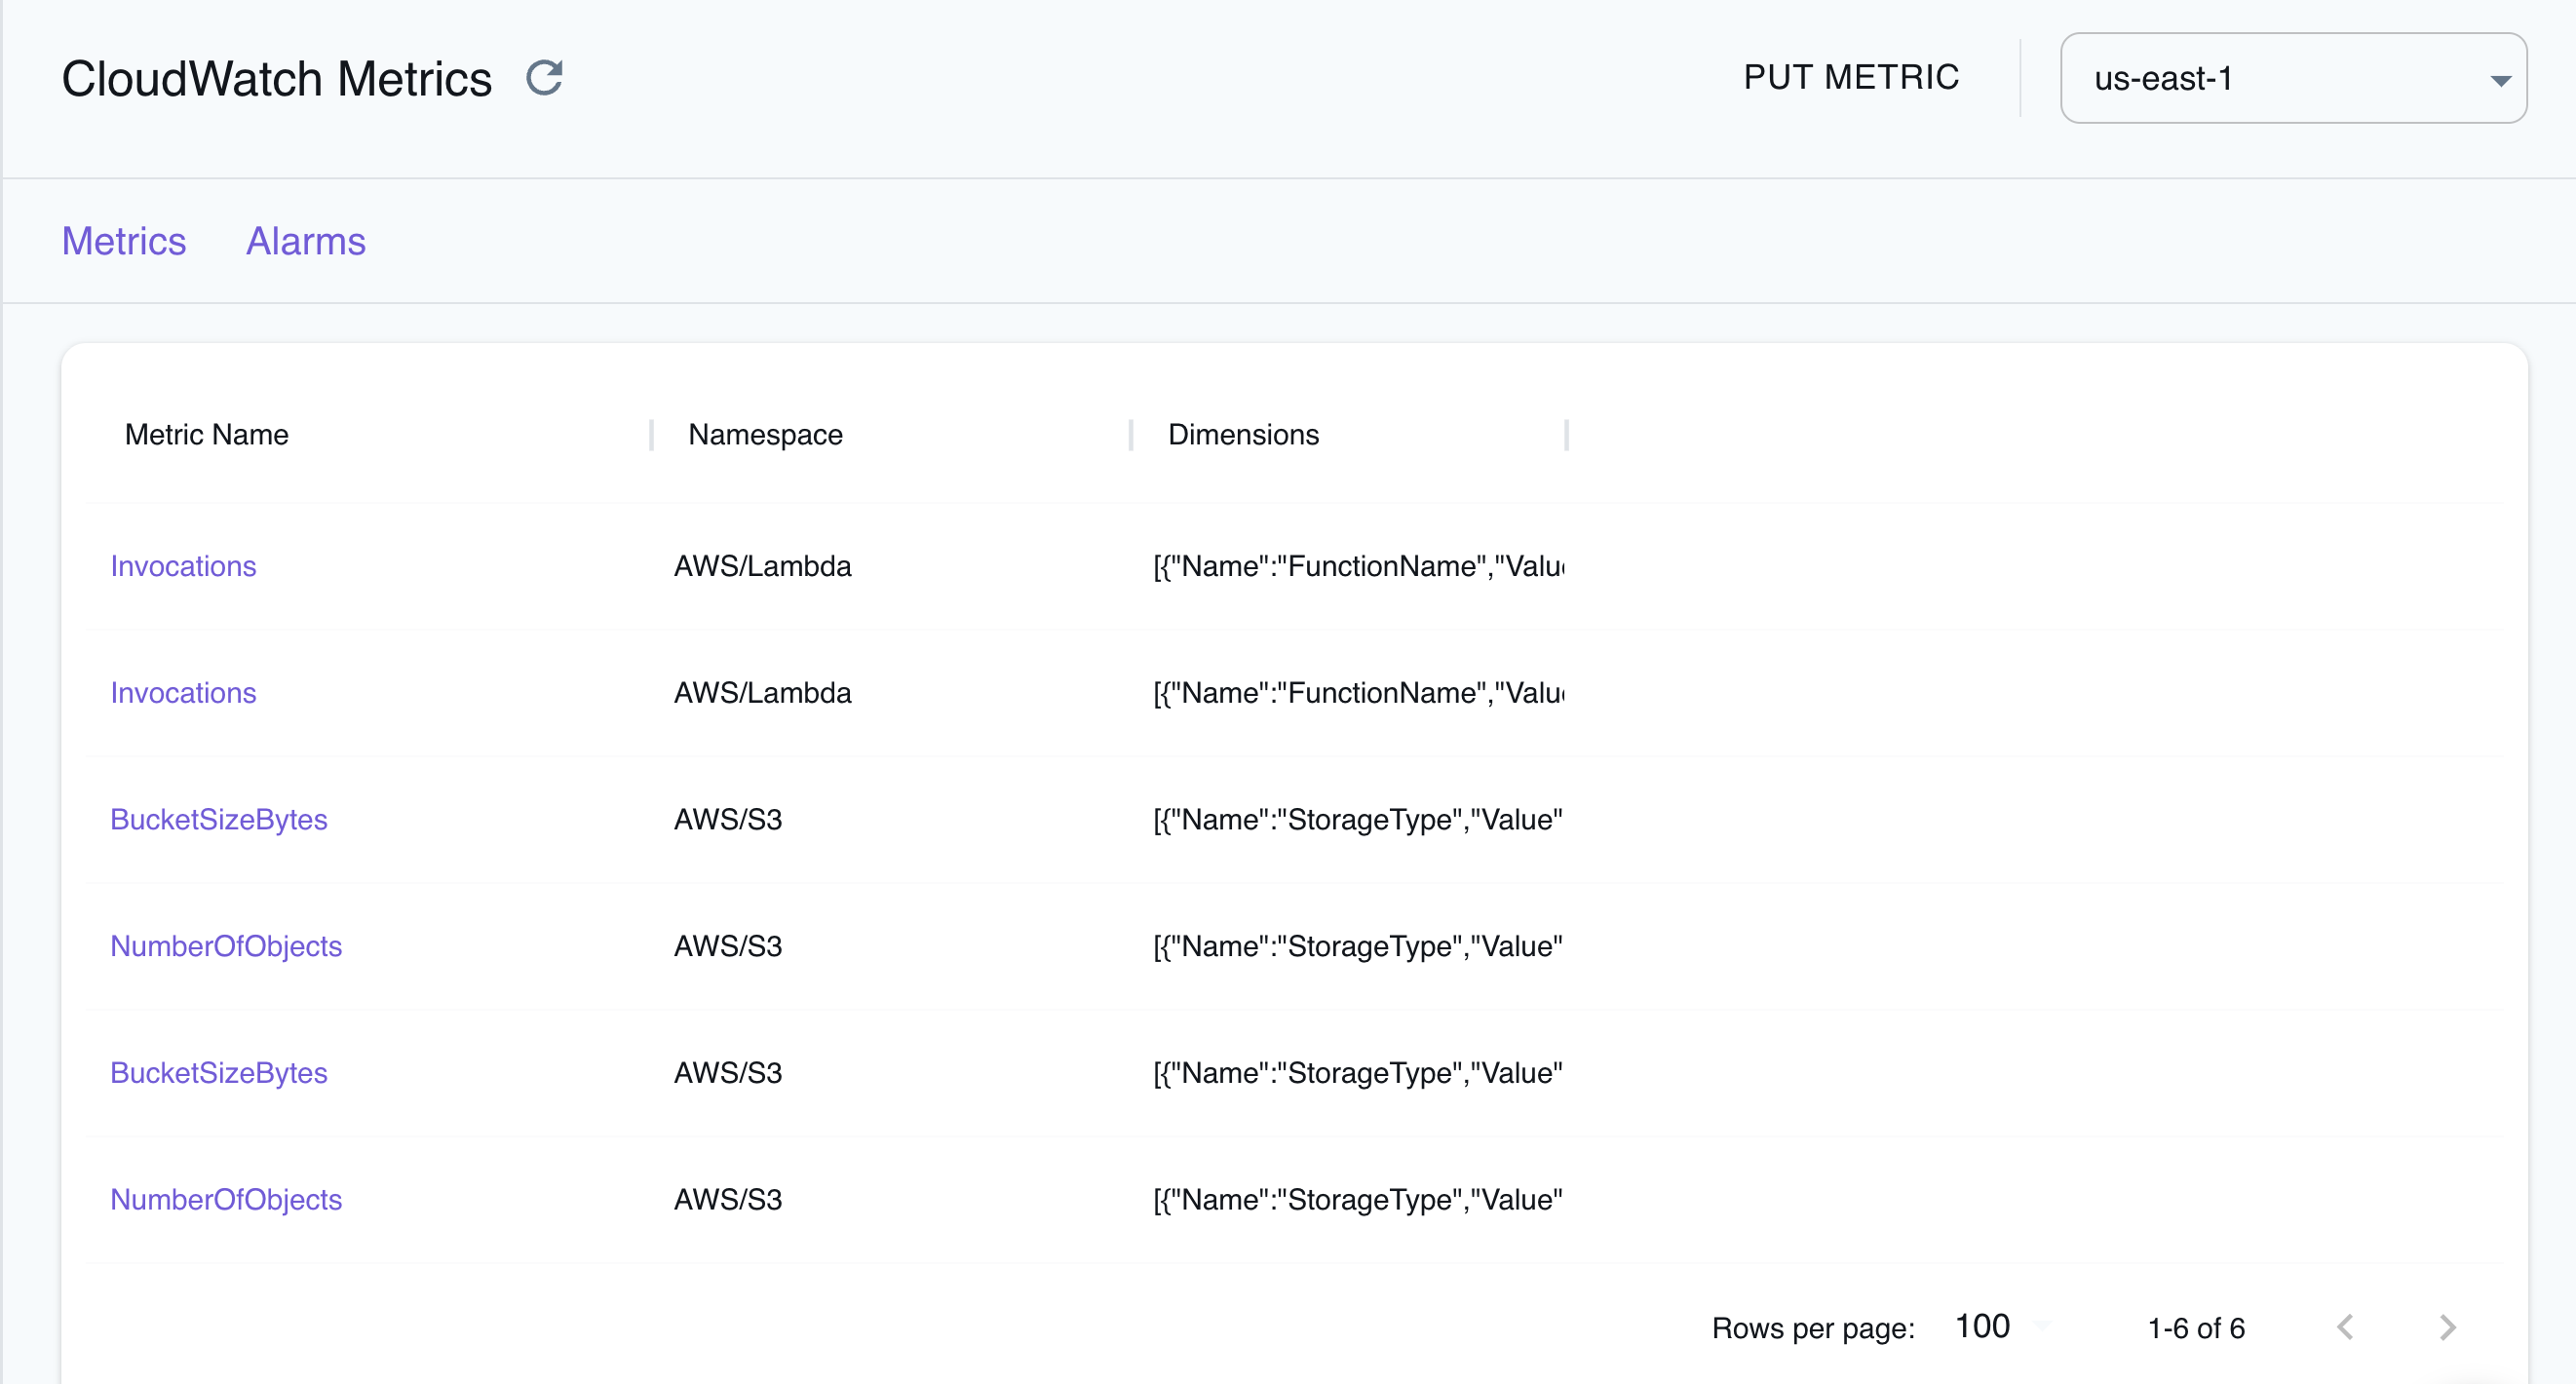
Section titled “Resource Browser”The LocalStack Web Application provides a Resource Browser for managing CloudWatch logs. You can access the Resource Browser by opening the LocalStack Web Application in your browser and navigating to the Resources section, then clicking on CloudWatch Logs and CloudWatch Metrics under the Management/Governance section.
The Resource Browser allows you to perform the following actions:


- Create Log Group: Create a new log group by specifying the
Log Group Name,KMS Key ID, andTags. - Put metric: Create a new metric by specifying the
NamespaceandMetric Data. - Put Alarm: Create a new alarm by specifying the
Alarm Name,Alarm Description,Actions Enabled,Metric Name,Namespace,Statistic,Comparison Operator,Threshold,Evaluation Periods,Period,Unit,Treat Missing Data,Tags, andAlarm Actions. - Check the Resources: View and manage existing log groups, metrics, and alarms and perform actions such as
Delete,View, andEdit.
Examples
Section titled “Examples”The following code snippets and sample applications provide practical examples of how to use CloudWatch in LocalStack for various use cases:
- Creating Cloudwatch metric alarms to demonstrate a simple example for creating CloudWatch metric alarm based on the metrics of a failing Lambda function.
- Event-driven architecture with Amazon SNS FIFO, DynamoDB, Lambda, and S3 to deploy a recruiting agency application with a job listings website and view the CloudWatch logs.
API Coverage
Section titled “API Coverage”| Operation ▲ | Implemented ▼ | Verified on Kubernetes |
|---|